How to change max database connections
警告:手动配置连接数会将其硬编码。这意味着如果你升级或降级数据库,连接数不会自动调整。你需要确保手动更新它。
更改最大数据库连接数 #
🌐 Changing max database connections
每个计算实例都有默认的直接连接和连接池设置。你可以在计算文档中找到最新的设置:
🌐 Each compute instance has a default direct connection and pooler connection settings. You can find the most recent settings in the compute docs:
| 计算规模 | 直接连接数 | 池化连接数 |
|---|---|---|
| Nano(免费) | 60 | 200 |
| Micro | 60 | 200 |
| Small | 90 | 400 |
| Medium | 120 | 600 |
| Large | 160 | 800 |
| XL | 240 | 1,000 |
| 2XL | 380 | 1,500 |
| 4XL | 480 | 3,000 |
| 8XL | 490 | 6,000 |
| 12XL | 500 | 9,000 |
| 16XL | 500 | 12,000 |
配置直接连接限制 #
🌐 Configuring direct connections limits
注意:Supavisor 的连接限制是硬编码的,无法更改,除非升级计算规模:
你可以使用 Supabase CLI 配置 Postgres 可容忍的最大连接数。
🌐 You can configure the maximum amount of connections that Postgres will tolerate with the Supabase CLI.
你可以运行以下命令:
🌐 You can run the following commands:
1npx supabase login23npx supabase --experimental --project-ref <PROJECT REF> postgres-config update --config max_connections=<INTEGER VALUE>然后你可以在 SQL 编辑器里运行以下 SQL,看看更改是否生效:
🌐 Then you could run the following SQL in the SQL Editor to see if the changes went through:
1SHOW max_connections;增加直接连接限制的风险 #
🌐 Dangers of increasing the direct connection limits
在调整直接连接限制时,需要考虑三个因素:
进程调度器和 Postgres 内部机制 #
🌐 Process schedulers and Postgres internals
在数据库中允许过多的直接连接会让 Postgres 的调度器和其他内部模块不堪重负。即使有更多连接可用,也会导致查询吞吐量明显下降。EnterpriseDB 写了一篇很棒的文章,详细说明了一些需要注意的事项。
🌐 Allowing too many direct connections in your database can overburden Postgres schedulers and other internal modules. This will result in a noticeable decrease in query throughput, despite having more connections available. EnterpriseDB wrote a wonderful article that outlines some of the considerations.
默认的连接值是基于对Postgres架构的深刻理解而设置的,偏离它们太远很可能会影响性能。不过,通过一些尝试,你可能会发现更适合你具体需求的值。尽管如此,除非有充分的理由去调整设置,否则通常建议保持默认值,或者谨慎地修改这些值。
🌐 The default connection values are set based on a solid understanding of Postgres architecture, and straying too far from them is likely to hinder performance. However, with some experimentation, you might discover a value better suited to your specific needs. Still, unless there's a compelling reason to adjust the setting, it's generally advisable to stick with the defaults or change the values judiciously.'
记忆 #
🌐 Memory
如果你不知道如何使用 Supabase Grafana 监控内存和 CPU,点这里。
每个直接连接都是一个正在运行的进程,会占用活动内存 #
🌐 Each direct connection is a running process that will consume active memory
这是一个关于不健康内存使用情况的 Grafana 图表:
🌐 This is a Grafana Chart of unhealthy memory usage:
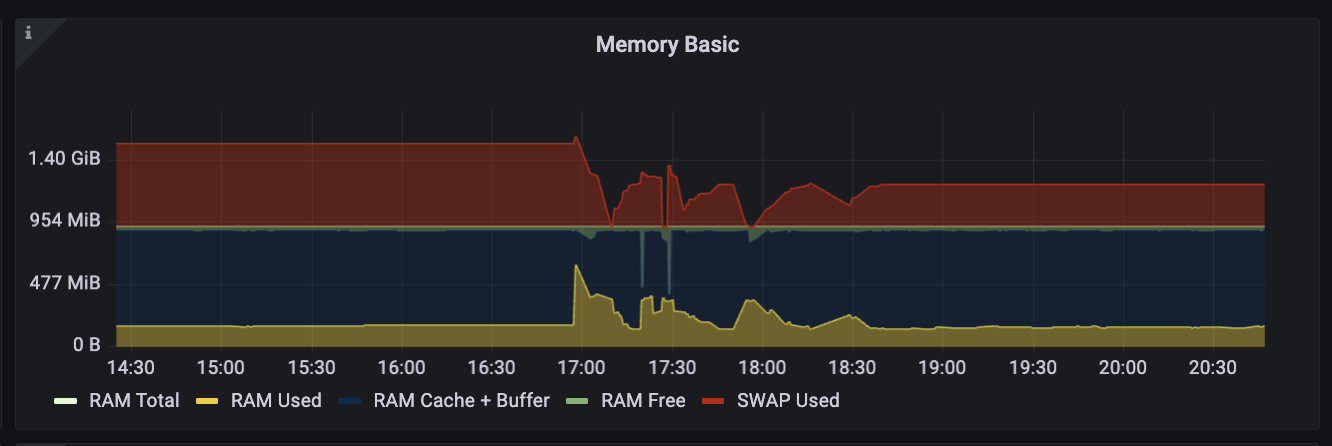
- 黄色:代表活动记忆
- 红色:表示 SWAP,它是磁盘存储,系统会将其当作内存来处理
- 绿色:它是未被占用的(系统总会保留一些未被占用的内存)
- 蓝色:它是缓存数据和一个缓冲区
Postgres 中的缓存很重要,因为数据库会把经常访问的数据存储在里面以便快速获取。如果需要太多活动内存,就有可能过度挤占缓存。这会迫使查询去检查磁盘,这会很慢。
🌐 The cache in Postgres is important because the database will store frequently accessed data in it for rapid retrieval. If too much active memory is needed, it runs the risk of excessively displacing cache. This will force queries to check disk, which is slow.
数据库中的大多数数据都是闲置的。不过,当可用内存很少或者未缓存的数据被快速访问时,可能会发生抖动。
为了避免替换缓存或过度消耗系统资源,建议不要增加直接连接,除非你有明显多余的未使用内存(绿色)。
🌐 To avoid displacing cache or straining system resources, it is advised to not increase your direct connections unless you have a clear excess of unclaimed memory (green).
Postgres 允许你超额分配内存。你可以运行下面的查询,来找出在不冒内存故障风险的情况下,你可以将其改到的理论最大值:
🌐 Postgres will allow you to overcommit memory. You can run the below query to find out the hypothetical max value you could change it to without risking memory failure:
注意:你可以在计算附加组件文档中找到你的服务器内存
1select2 '(SERVER MEMORY - ' || current_setting('shared_buffers') || ' - (' || current_setting(3 'autovacuum_max_workers'4 ) || ' * ' || current_setting('maintenance_work_mem') || ')) / ' || current_setting('work_mem');中央处理器 #
🌐 CPU
下面的图表是一个例子,展示了如果每秒不适当地打开/关闭成百上千个连接,或者同时运行许多占用CPU的查询,CPU可能会发生的情况
🌐 The below chart is an example of what can occur to the CPU if 100s of connections are inappropriately opened/closed every second or many CPU intensive queries are run in parallel

如果你计划增加直接连接的数量,你的数据库应该有相对可预测或低的CPU使用率,就像下面的例子显示的那样:
🌐 If you plan on increasing your direct connection numbers, your database should have relatively predictable or low CPU usage, such as what the example displays below: