Interpreting Supabase Grafana CPU charts
指南 设置 Supabase Grafana
中央处理器 #
🌐 CPU
这里是一些不健康的 CPU 使用情况示例:
🌐 Here are examples of unhealthy CPU utilization:
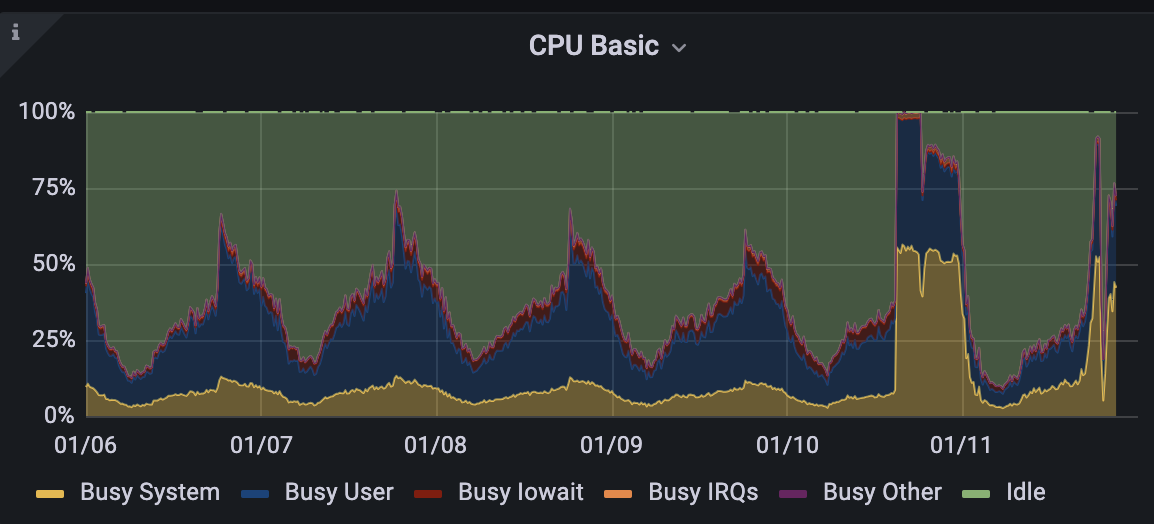
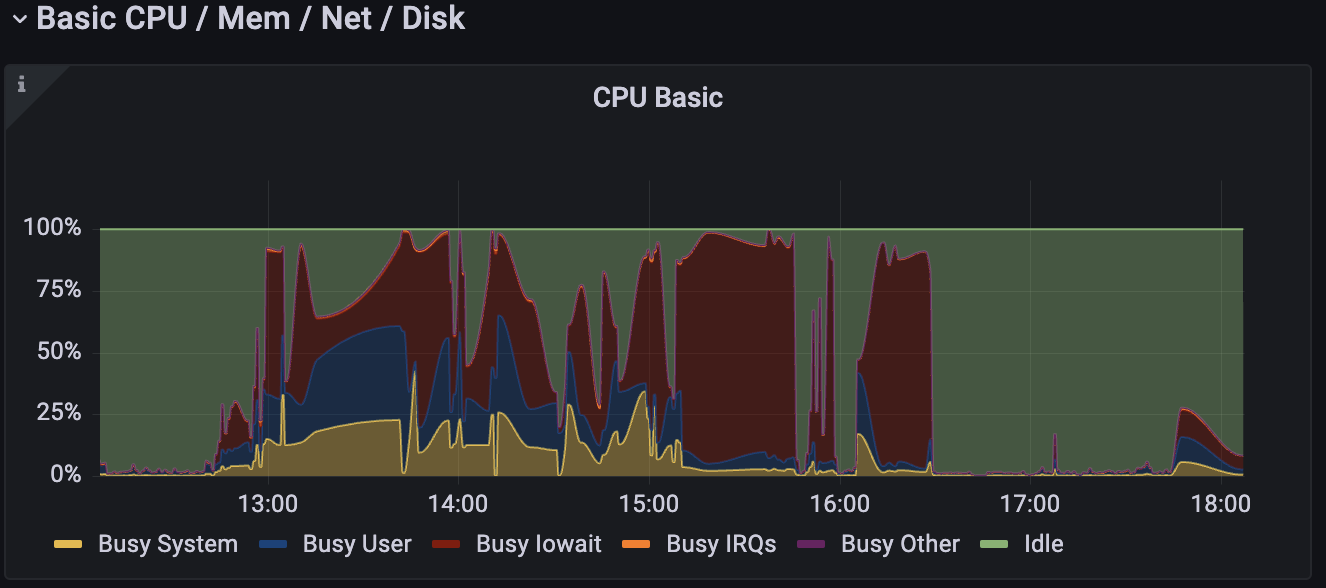
CPU 图表显示了 4 个不同的关注指标:
🌐 The CPU chart shows 4 distinct metrics of interest:
- 黄色:它表示 CPU 在 内核空间(特权操作系统操作)中的使用情况。如果这个值很高,可能意味着你的应用连接/断开连接过于频繁。这也可能是扩展相关错误的症状。
- 蓝色:它表示用户空间中的请求,主要反映常规查询的 CPU 使用情况。有关优化技巧,请查看页面末尾的链接。
- 红色:它表示 CPU 因等待 IO 任务而处于空闲状态的周期。大量红色通常意味着磁盘或间接地内存问题。这些链接说明了如何解决此类问题。
- 绿色:这些是空闲状态下消耗的 CPU 周期。
当 CPU 使用率接近 100% 时,查询和数据库任务会开始受限,因为它们没有足够的时间或 CPU 访问权限。
🌐 As the CPU peaks towards 100%, queries and database tasks will begin to throttle, as they won't have enough time or access to the CPU.
其他有用的 Supabase Grafana 指南: #
🌐 Other useful Supabase Grafana guides:
优化中 #
🌐 Optimizing
- 优化你的查询。
- 如果可能的话,添加索引。
- 增加计算规模
- 通过使用只读副本分配负载