Interpreting Supabase Grafana IO charts
有两个主要的数值对 IO 很重要:
🌐 There are two primary values that matter for IO:
- 磁盘吞吐量:每秒可以从磁盘传输的数据量
- IOPS(每秒输入/输出操作次数):每秒你的磁盘可以执行多少读/写请求
每个计算实例都有独特的 I/O 设置。当前的基础(持续)和最大(突发)限制如下所示。
🌐 Each compute instance has unique IO settings. The current baseline (sustained) and max (burst) limits are listed below.
| Compute Instance | Baseline Throughput (MB/s) | Max Throughput (MB/s) | Baseline IOPS | Max IOPS |
|---|---|---|---|---|
| Nano (free) | 5 MB/s | 261 MB/s | 250 IOPS | 11,800 IOPS |
| Micro | 11 MB/s | 261 MB/s | 500 IOPS | 11,800 IOPS |
| Small | 22 MB/s | 261 MB/s | 1,000 IOPS | 11,800 IOPS |
| Medium | 43 MB/s | 261 MB/s | 2,000 IOPS | 11,800 IOPS |
| Large | 79 MB/s | 594 MB/s | 3,600 IOPS | 20,000 IOPS |
| XL | 149 MB/s | 594 MB/s | 6,000 IOPS | 20,000 IOPS |
| 2XL | 297 MB/s | 594 MB/s | 12,000 IOPS | 20,000 IOPS |
| 4XL | 594 MB/s | 594 MB/s | 20,000 IOPS | 20,000 IOPS |
| 8XL | 1,188 MB/s | 1,188 MB/s | 40,000 IOPS | 40,000 IOPS |
| 12XL | 1,781 MB/s | 1,781 MB/s | 50,000 IOPS | 50,000 IOPS |
| 16XL | 2,375 MB/s | 2,375 MB/s | 80,000 IOPS | 80,000 IOPS |
| 24XL | 3,750 MB/s | 3,750 MB/s | 120,000 IOPS | 120,000 IOPS |
| 24XL - Optimized CPU | 3,750 MB/s | 3,750 MB/s | 120,000 IOPS | 120,000 IOPS |
| 24XL - Optimized Memory | 3,750 MB/s | 3,750 MB/s | 120,000 IOPS | 120,000 IOPS |
| 24XL - High Memory | 3,750 MB/s | 3,750 MB/s | 120,000 IOPS | 120,000 IOPS |
| 48XL | 5,000 MB/s | 5,000 MB/s | 240,000 IOPS | 240,000 IOPS |
| 48XL - Optimized CPU | 5,000 MB/s | 5,000 MB/s | 240,000 IOPS | 240,000 IOPS |
| 48XL - Optimized Memory | 5,000 MB/s | 5,000 MB/s | 240,000 IOPS | 240,000 IOPS |
| 48XL - High Memory | 5,000 MB/s | 5,000 MB/s | 240,000 IOPS | 240,000 IOPS |
XL 以下的计算大小在短时间内可能会高于基线,然后再回到它们的基线表现。
🌐 Compute sizes below XL can burst above baseline for short periods before returning back to their baseline behavior.
还有其他指标可以显示 IO 压力。
🌐 There are other metrics that indicate IO strain.
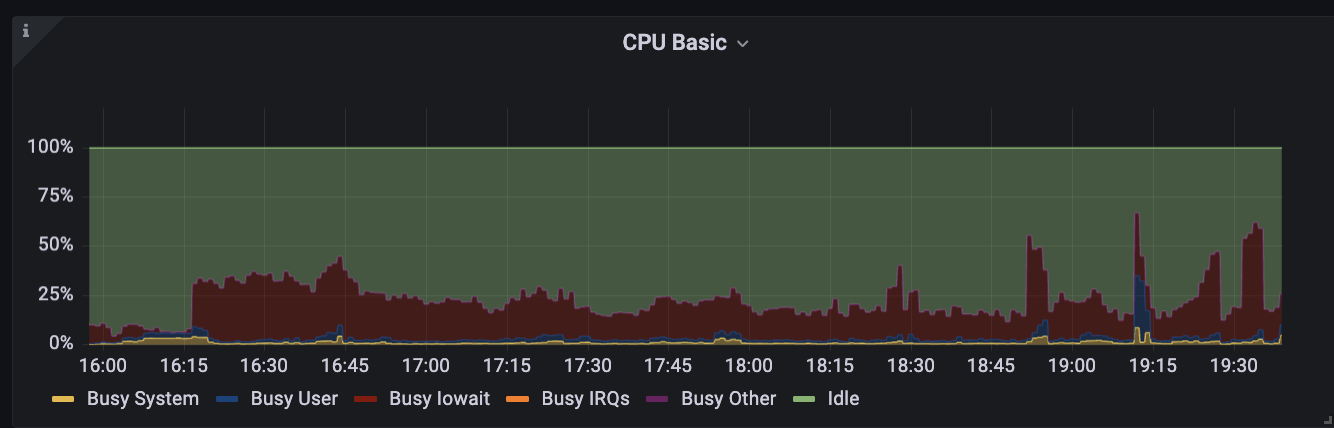
这个例子展示了一个16XL数据库出现严重的IO压力:
🌐 This example shows a 16XL database exhibiting severe IO strain:
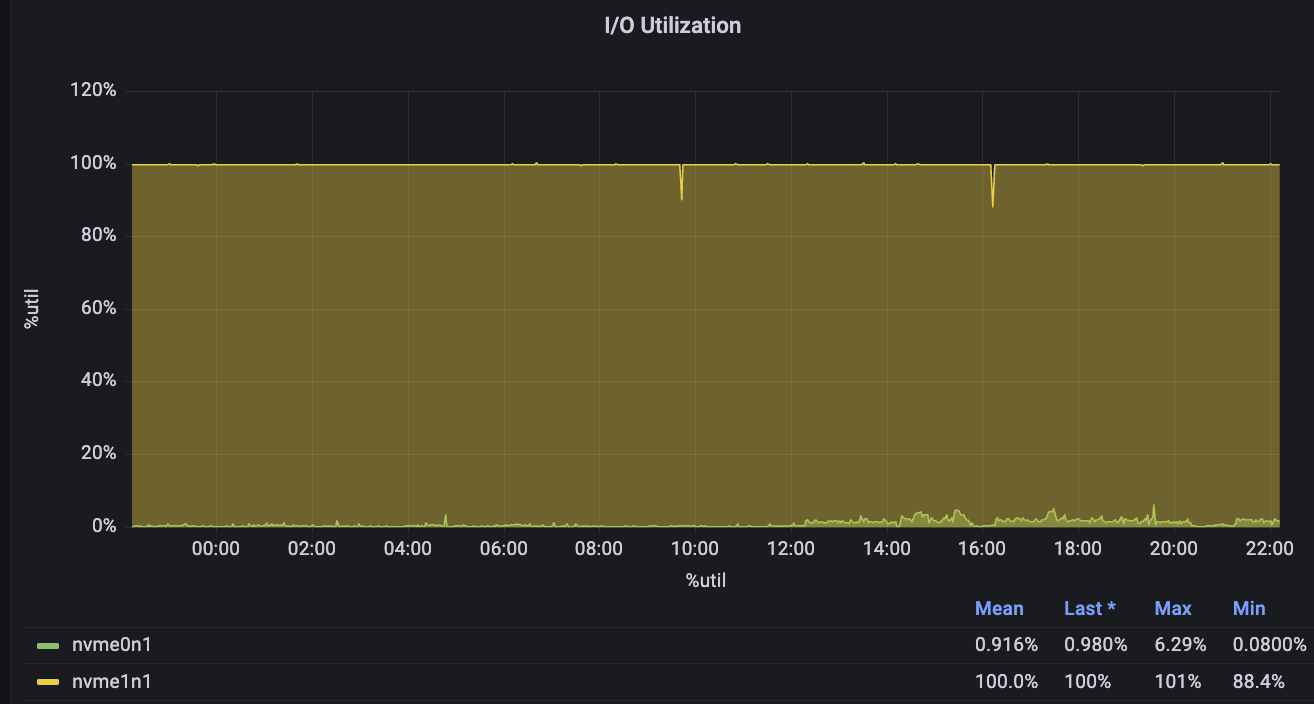
它的磁盘 IOPS 一直接近峰值:
🌐 Its Disk IOPS is constantly near peak capacity:
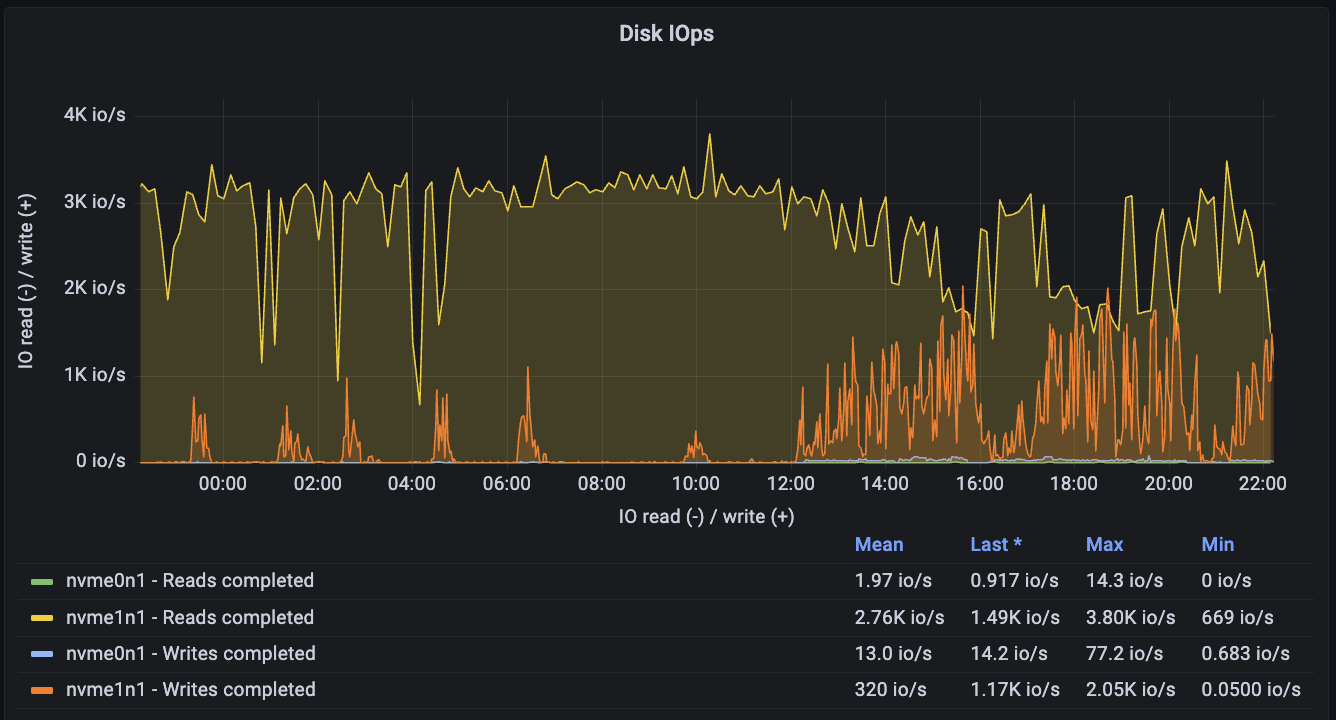
它的吞吐量也很高:
🌐 Its throughput is also high:

作为副作用,它的 CPU 被大量的 Busy IOWait 活动拖慢了:
🌐 As a side-effect, its CPU is encumbered by heavy Busy IOWait activity:
过度的 IO 使用是非常有问题的,因为它表明你的数据库正在消耗比正常应管理的更多的 IO。这可能是由以下原因引起的
🌐 Excessive IO usage is highly problematic as it clarifies that your database is expending more IO than it normally is intended to manage. This can be caused by
- 过多且不必要的顺序扫描: 索引不完善的表会迫使请求扫描磁盘(解决指南)
- 缓存太小:内存不够,因此数据不是从内存缓存中读取,而是从磁盘访问(检查指南)
- 优化不佳的 RLS 策略:依赖大量连接的 RLS 更有可能使用到磁盘。如果可能的话,应该对它们进行优化(RLS 最佳实践指南)
- 过度膨胀:这最不可能引起重大问题,但膨胀会占用空间,导致磁盘上的数据无法放在相同位置。这可能会迫使数据库扫描比必要更多的页面。(解释指南)
- **上传大量数据:**在上传期间临时增加计算附加组件的大小
- 内存不足:有时内存量不足会导致查询访问磁盘而不是内存缓存。解决内存问题(指南)可以减轻磁盘压力。
如果一个数据库长时间显示出这些指标中的一些,那么有几种主要的方法:
🌐 If a database exhibited some of these metrics for prolonged periods, then there are a few primary approaches:
其他有用的 Supabase Grafana 指南:
🌐 Other useful Supabase Grafana guides:
深奥因素 #
🌐 Esoteric factors
Webhooks:
Supabase 的 webhooks 使用 pg_net 扩展来处理请求。net.http_request_queue 表没有建立索引,以保持写入成本较低。不过,如果你在短时间内向支持 webhook 的表上传数百万行数据,可能会显著增加该扩展的读取成本。
要检查读取是否变得昂贵,运行:
🌐 To check if reads are becoming expensive, run:
1select count(*) as exact_count from net.http_request_queue;2-- the number should be relatively low <20,000如果你遇到这个问题,你可以选择以下方式之一:
🌐 If you encounter this issue, you can either:
- 增加你的计算资源来帮助处理大量请求。
- 截断表以清空队列:
1TRUNCATE net.http_request_queue;