Understanding the Usage Summary on the Dashboard
组织使用情况指标 #
🌐 Organization usage metrics
本讨论解释了贵组织的使用指标,你可以在这里查看:https://supabase.com/dashboard/org/_/usage。
🌐 This discussion explains your organization's usage metrics, which can be found here: https://supabase.com/dashboard/org/_/usage.
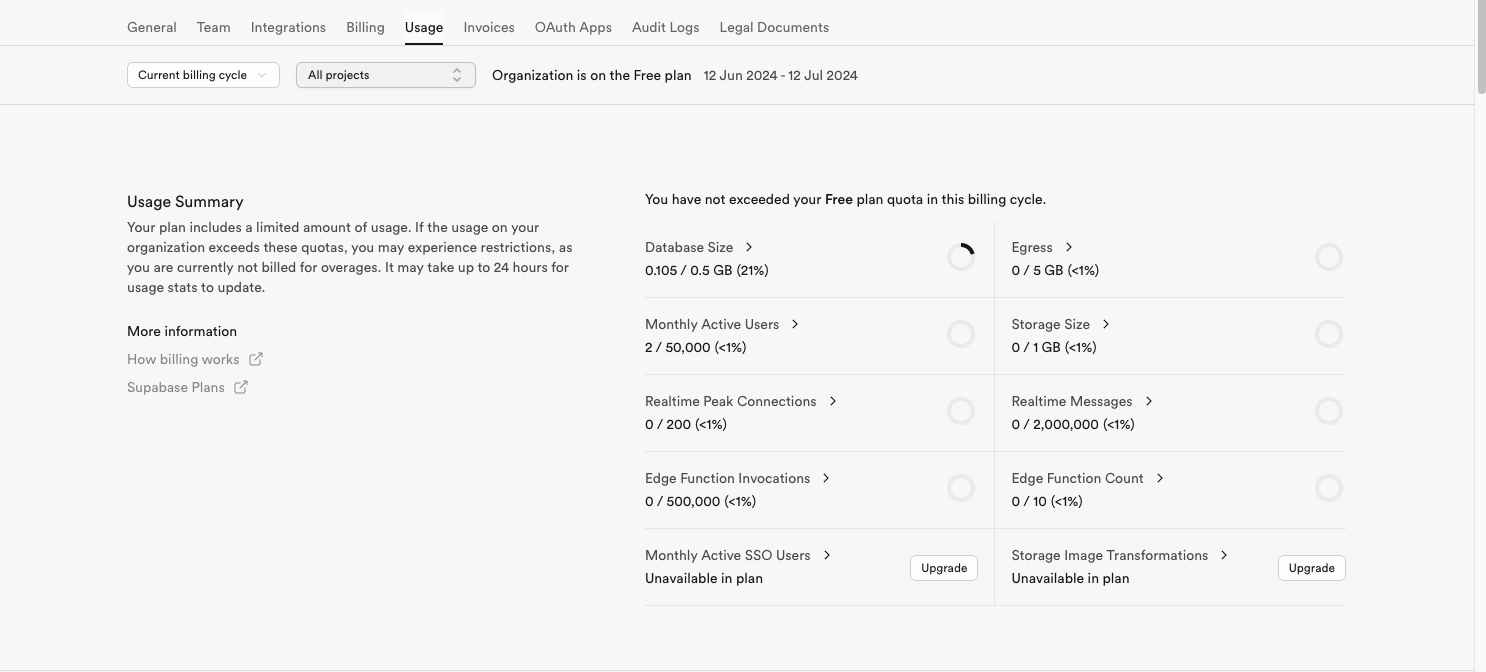
这些指标是基于组织下所有符合这些标准的项目计算的:
🌐 These metrics are calculated based on all the projects under the organization that meet these criteria:
- 当前活跃的项目
- 在当前计费周期内曾经活跃一段时间但目前不活跃的项目
对于只看当前活跃项目使用哪些指标的用户来说,这可能会有些困惑。
🌐 This may be confusing for users looking at only what metrics are being used for currently active projects.
数据库大小示例 #
🌐 Database size example
以数据库大小为例,假设我们在组织下有以下项目:
🌐 Using the database size as an example, suppose we have the following projects under the organization:
- 项目A:1 GB 数据库大小
- 项目B:0.5 GB 数据库大小
- 项目C:0.5 GB 数据库大小
如果用户决定在当前计费周期内删除项目 A 和 B,那么本计费周期的平均数据库使用量将是 2 GB,尽管当前只有 0.5 GB 的数据库在使用。
🌐 If the user decides to delete Projects A and B during the current billing cycle, the average database usage will be 2 GB for the current billing cycle, even though only a 0.5 GB database is currently active.
截至目前,即使你的项目只活跃了几天,我们也会取这些活跃天数的平均数据库大小,这可能会导致在一个计费周期内创建和删除很多项目时使用量很高。我们正在研究一个更好的计费模型来应对这种情况。
🌐 As of now, even if your project was only active for a few days, we take the average database size for those active days, which may lead to high usage when creating and deleting many projects within a billing cycle. We're working on a better billing model to cover these cases.
边缘函数示例 #
🌐 Edge Functions example
再来看一个关于边缘函数的例子。假设我们在组织下有这些项目:
🌐 Consider another example with edge functions. Suppose we have these projects under the organization:
- 项目 D:5 个边缘功能
- 项目 E:7 个边缘函数
如果在本计费周期内删除拥有7个功能的E项目,仪表板上本计费周期的平均Edge功能数量仍然会是12个功能。
🌐 If Project E with its 7 functions is deleted during the current billing cycle, the average Edge Function count for this billing cycle on the dashboard will still be 12 functions.
其他指标 #
🌐 Other metrics
理解像实时和出站这样的指标会稍微有点棘手,因为相比数据库大小或函数数量,它们更难跟踪使用情况。不过,它们也会计算所有在你当前计费周期中处于活跃状态或曾经活跃的项目的使用情况。
🌐 It is a little more tricky to understand metrics like realtime and egress due to being more complex to track usage compared to Database size or Function count. However, they will account for usage from all projects that are active or were active during your current billing cycle as well.
指标看起来还是怪怪的或者不对吗? #
🌐 Metrics still look weird or incorrect?
如果未使用的项目的数字会结转到下一个计费周期,而且没有新的使用情况,那可能有问题。
🌐 If the numbers from inactive projects carry over to the next billing cycle and no new usage has occurred, something might be wrong.
如果是这种情况,或者你不确定为什么某些使用情况会以这种方式出现,无论出于什么原因,你都应该通过仪表板联系支持:https://supabase.com/dashboard/support/new
🌐 If this is the case, or if you are unsure why any usage appears the way it does for any reason, you should reach out to Support on the dashboard here: https://supabase.com/dashboard/support/new.