Steps to improve query performance with indexes
优化你的数据库 #
🌐 Optimizing your database
这是一个适用于 Supabase 生态系统中 Postgres 优化的中级可操作指南。
🌐 This is an intermediate and actionable guide for Postgres optimization within the Supabase ecosystem.
可以考虑看看现在仪表板中提供的 Index_advisor 和 performance advisor!
安装 Supabase Grafana #
🌐 Installing Supabase Grafana
Supabase 有一个 开源 Grafana 仓库,可以显示你数据库的实时指标。虽然 可观测性仪表盘 提供了类似的指标,但它是按小时或按天来平均数据的。了解数据库对变化的响应情况有助于确保数据库在建立索引的过程中不会过载。
🌐 Supabase has an open-source Grafana Repo that displays real-time metrics of your database. Although the Observability Dashboard provides similar metrics, it averages the data by the hour or day. Having visibility over how your database responds to changes helps to ensure that the database is not stressed by the index-building process.
Grafana 仪表板视觉效果
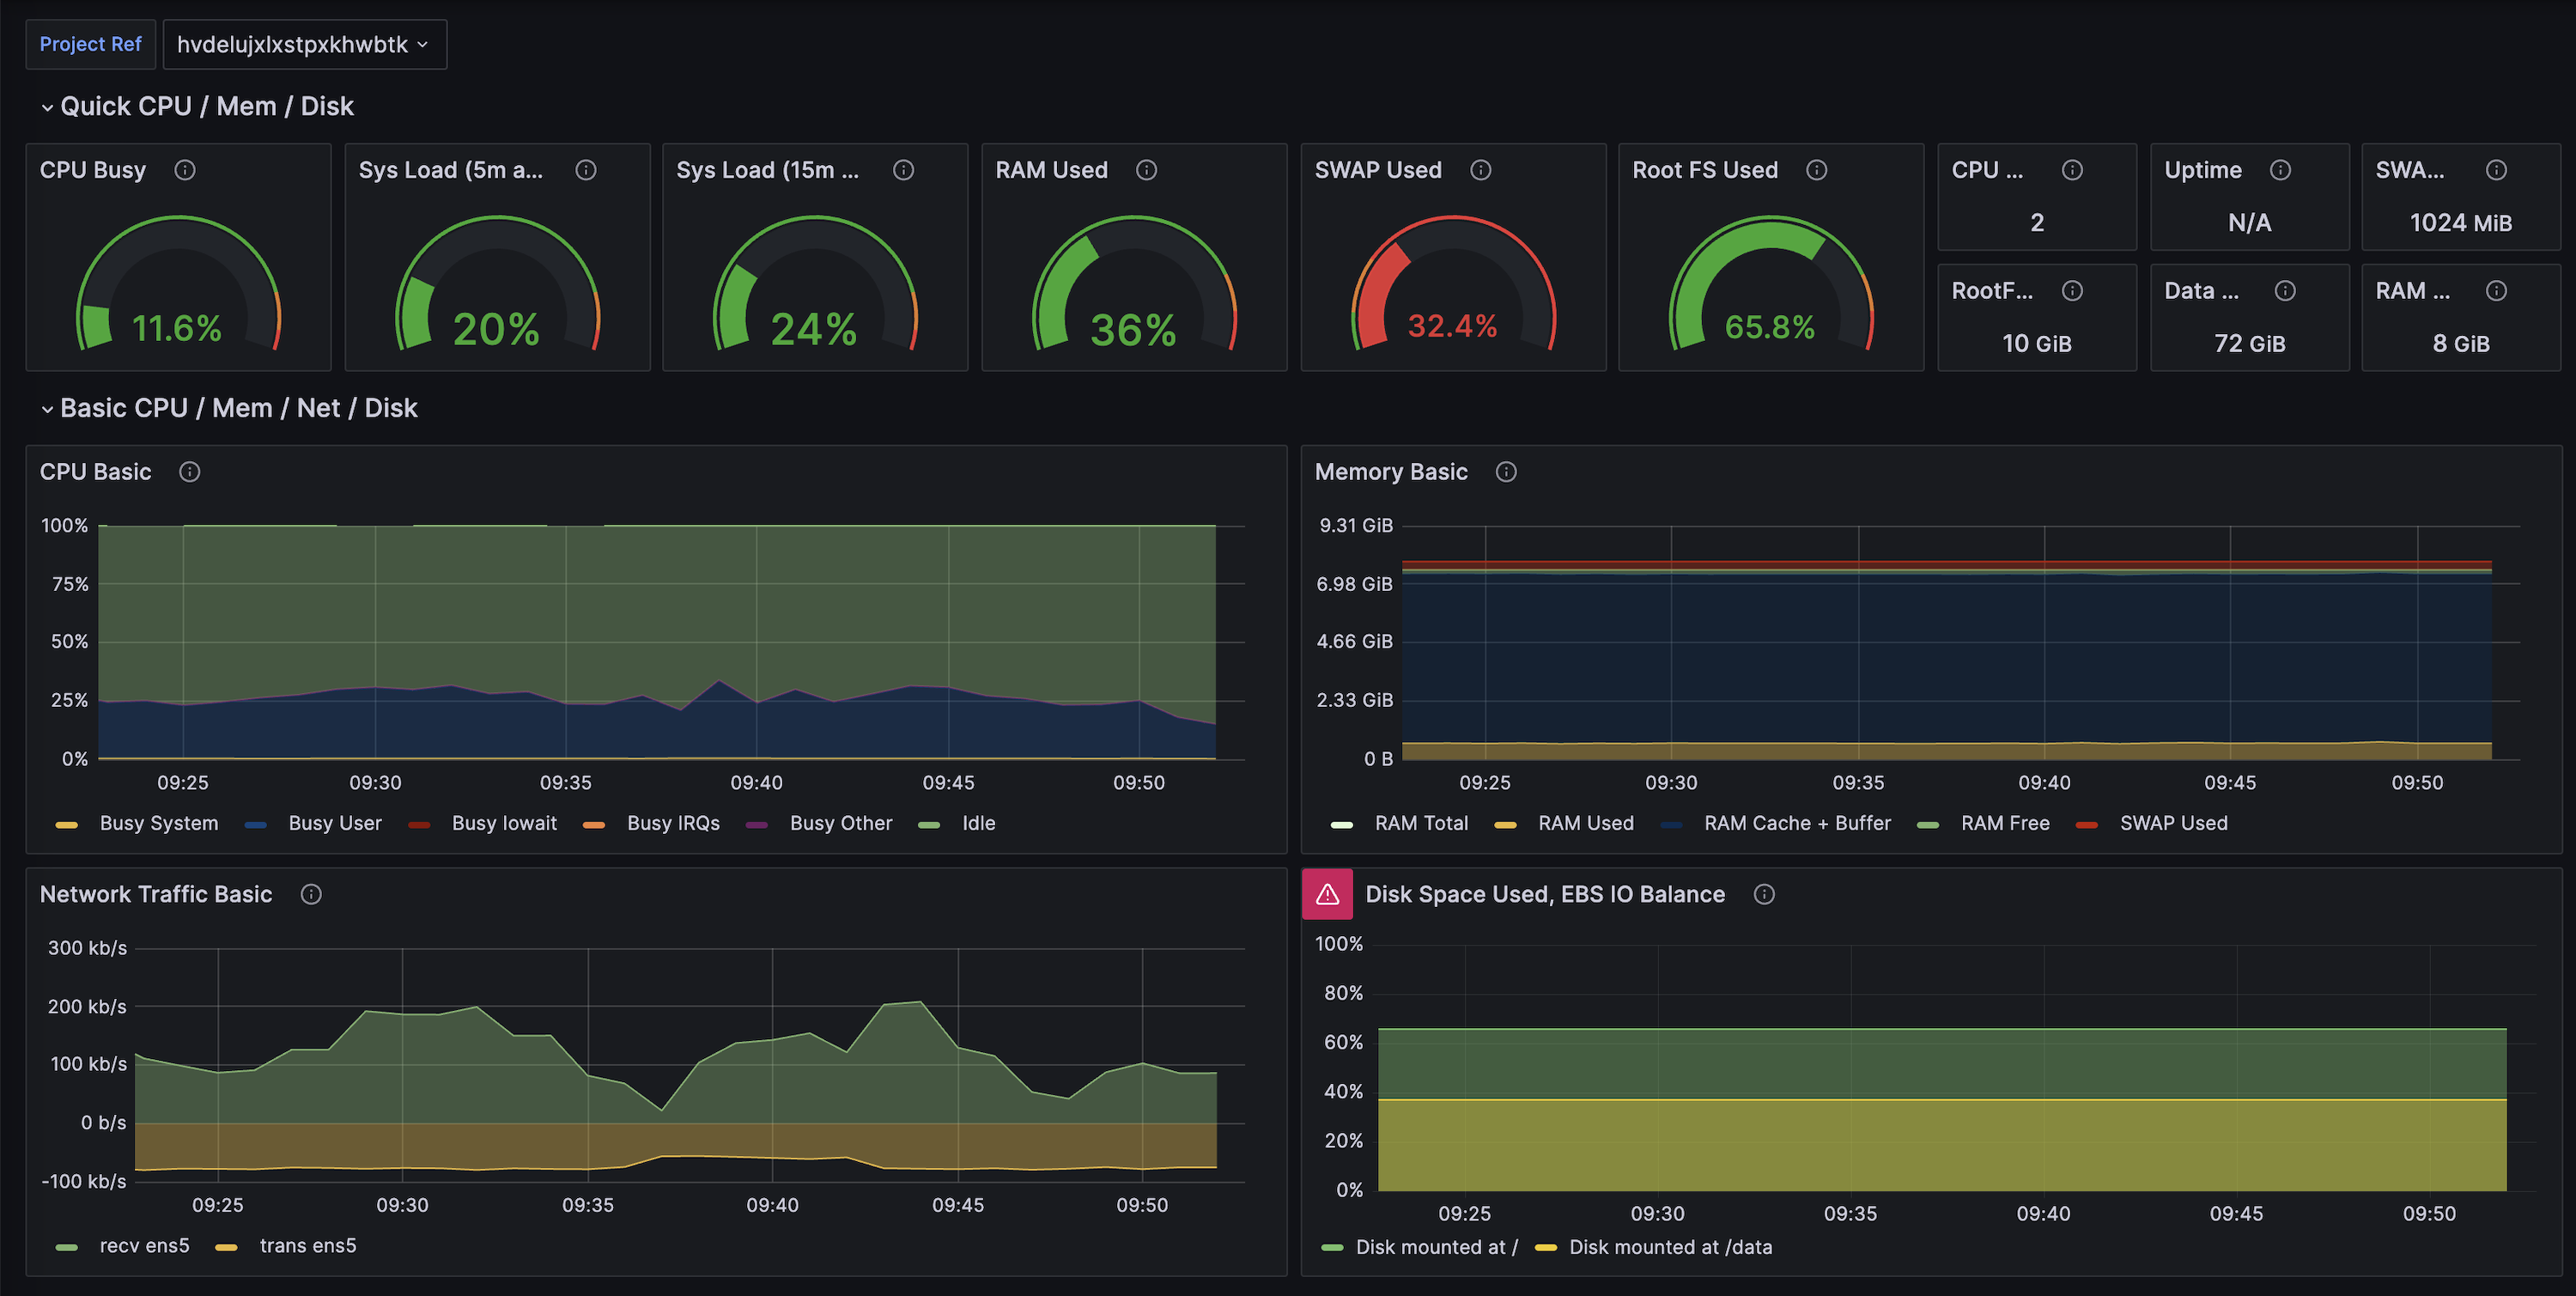
🌐 Visual of Grafana Dashboard
它可以在本地的 Docker 中运行,也可以免费部署到 fly.io。安装说明可以在 Supabase 的指标文档 中找到。
🌐 It can be run locally within Docker or can be deployed for free to fly.io. Installation instructions can be found in Supabase's metrics docs
通过索引进行查询优化 #
🌐 Query optimization through indexes
磁盘(存储)比内存相对慢,所以 Postgres 会把常用的数据取出来缓存到内存中,以便快速访问。
🌐 Disk (storage) is relatively slow compared to memory, so Postgres will take frequently accessed data and cache it in memory for fast access.
理想情况下,你希望缓存命中率(cache-hits/total-hits)达到 99%。你可以尝试在你的实例上运行以下查询:
🌐 Ideally, you want the cache hit rate (cache-hits/total-hits) to be 99%. You should try to run the following query on your instance:
1select2 'index hit rate' as name,3 (sum(idx_blks_hit)) / nullif(sum(idx_blks_hit + idx_blks_read), 0) as ratio4from pg_statio_user_indexes5union all6select7 'table hit rate' as name,8 sum(heap_blks_hit) / nullif(sum(heap_blks_hit) + sum(heap_blks_read), 0) as ratio9from pg_statio_user_tables;如果缓存命中率相对较低,这通常意味着你需要增加内存容量。第二个经常检查的指标是索引使用情况。索引是允许 Postgres 高效搜索信息的数据结构——可以把它们想象成书本后面的索引。你不需要逐页(或逐行)扫描,而是可以用索引高效地找到所需内容。想更好地理解 Postgres 如何决定是否使用索引,可以看看这个讲解。
🌐 If the cache hit rate is relatively low, it often means that you need to increase your memory capacity. The second metric that is often inspected is index usage. Indexes are data structures that allow Postgres to search for information efficiently - think of them like you would think of an index at the back of a book. Instead of scanning every page (or row), you can use an index to find the contents you need efficiently. For a better understanding of how Postgres decides on whether to use an index or not, check out this explainer.
索引命中率(索引被使用的频率)通常可以适度提高。
🌐 The index hit rate (how often an index is used) can usually be improved moderately.
有一个查询可以用来了解在访问表时索引的使用频率:
🌐 There's a query to find out how often an index is used when accessing a table:
1select2 relname,3 100 * idx_scan / (seq_scan + idx_scan) as percent_of_times_index_used,4 n_live_tup as rows_in_table5from pg_stat_user_tables6where seq_scan + idx_scan > 07order by n_live_tup desc;很多用于检查性能的查询已经作为Supabase CLI的一部分预打包了。例如,有一个命令可以测试哪些索引是多余的,占用了不必要的空间:
🌐 A lot of the queries for inspecting performance are pre-bundled as part of the Supabase CLI. For instance, there is a command for testing which indexes of yours are unnecessary and are needlessly taking up space:
1npx supabase login23npx supabase link45npx supabase inspect db unused-indexes有一个叫做 index_advisor 的扩展,它可以在你的查询上创建虚拟索引,然后检查哪些索引能最好地提升性能。不同于普通的索引创建,虚拟索引可以快速生成,这让发现最高性能的解决方案变得非常快。仪表板中的 Query Performance Advisor 配置为使用 index_advisor 来提出优化建议,你可以去看看,找找哪里还能改进。
🌐 There is an extension called index_advisor that creates virtual indexes on your queries and then checks which ones increase performance the best. Unlike normal index creation, virtual indexes can be made rapidly, which makes uncovering the most performant solutions fast. The Query Performance Advisor in the Dashboard is configured to use index_advisor to make optimization suggestions and you should check it out to see where you can improve.
Index_advisor 不会测试通过扩展添加的索引,也不会测试 GIN/GIST 索引。对于 JSON 或 ARRAY 列,可以考虑单独使用 GIN/GIST 索引而不是通过 index_advisor。如果你在使用 pg_vector,非常重要的一点是要使用 HSNW 索引。
🌐 Index_advisor won't test indexes added through extensions nor will it test GIN/GIST indexes. For JSON or ARRAY columns, consider exploring GIN/GIST indexes separately from index_advisor. If you're using pg_vector, it's crucial to use an HSNW index.
索引可以显著加快读取速度,有时性能可以提升100倍。不过,它们也有一个权衡:需要跟踪所有列的变化,这可能会让像UPDATE、DELETE和INSERT这样的修改数据的查询变慢。
🌐 Indexes can significantly speed up reads, sometimes boosting performance by 100 times. However, they come with a trade-off: they need to track all column changes, which can slow down data-modifying queries like UPDATEs, DELETEs, and INSERTs.
一般来说,索引带来的好处更多。比如,主键列会自动有一个 B 树索引,这可以提升读取和关联操作的性能,同时不会对写入查询造成太大影响。不过,随便添加索引还是不太明智的。
🌐 Generally, indexes offer more benefits. For example, primary key columns automatically have a B-Tree index, enhancing read and join operations without significantly affecting write queries. Nonetheless, it's wise to avoid carelessly adding indexes.
有些索引可能需要很长时间来构建。虽然有一份用于应用 HSNW 索引的指南,但它也可以推广并参考用于应用其他索引。
🌐 Some indexes may take a long time to build. A guide was written for applying HSNW indexes, but it can be generalized and referenced for applying others, too.
在创建索引时,受影响的表会被锁定,无法进行写操作。如果这会造成问题,可以使用 CONCURRENTLY 修饰符。不过,这种情况最好只在必要时使用,因为它会导致索引被创建两次,延长过程并增加计算成本。
🌐 When building an index, the affected table is locked, preventing write operations. If this poses an issue, use the CONCURRENTLY modifier. However, reserve this for necessary cases only, as it entails building the index twice, prolonging the process and increasing computational costs.