高级日志查询和过滤
日志浏览器 会显示 Supabase 各部分的日志,你可以用 SQL 来查询和过滤这些日志。
🌐 The Logs Explorer exposes logs from each part of the Supabase stack, which you can query and filter using SQL.
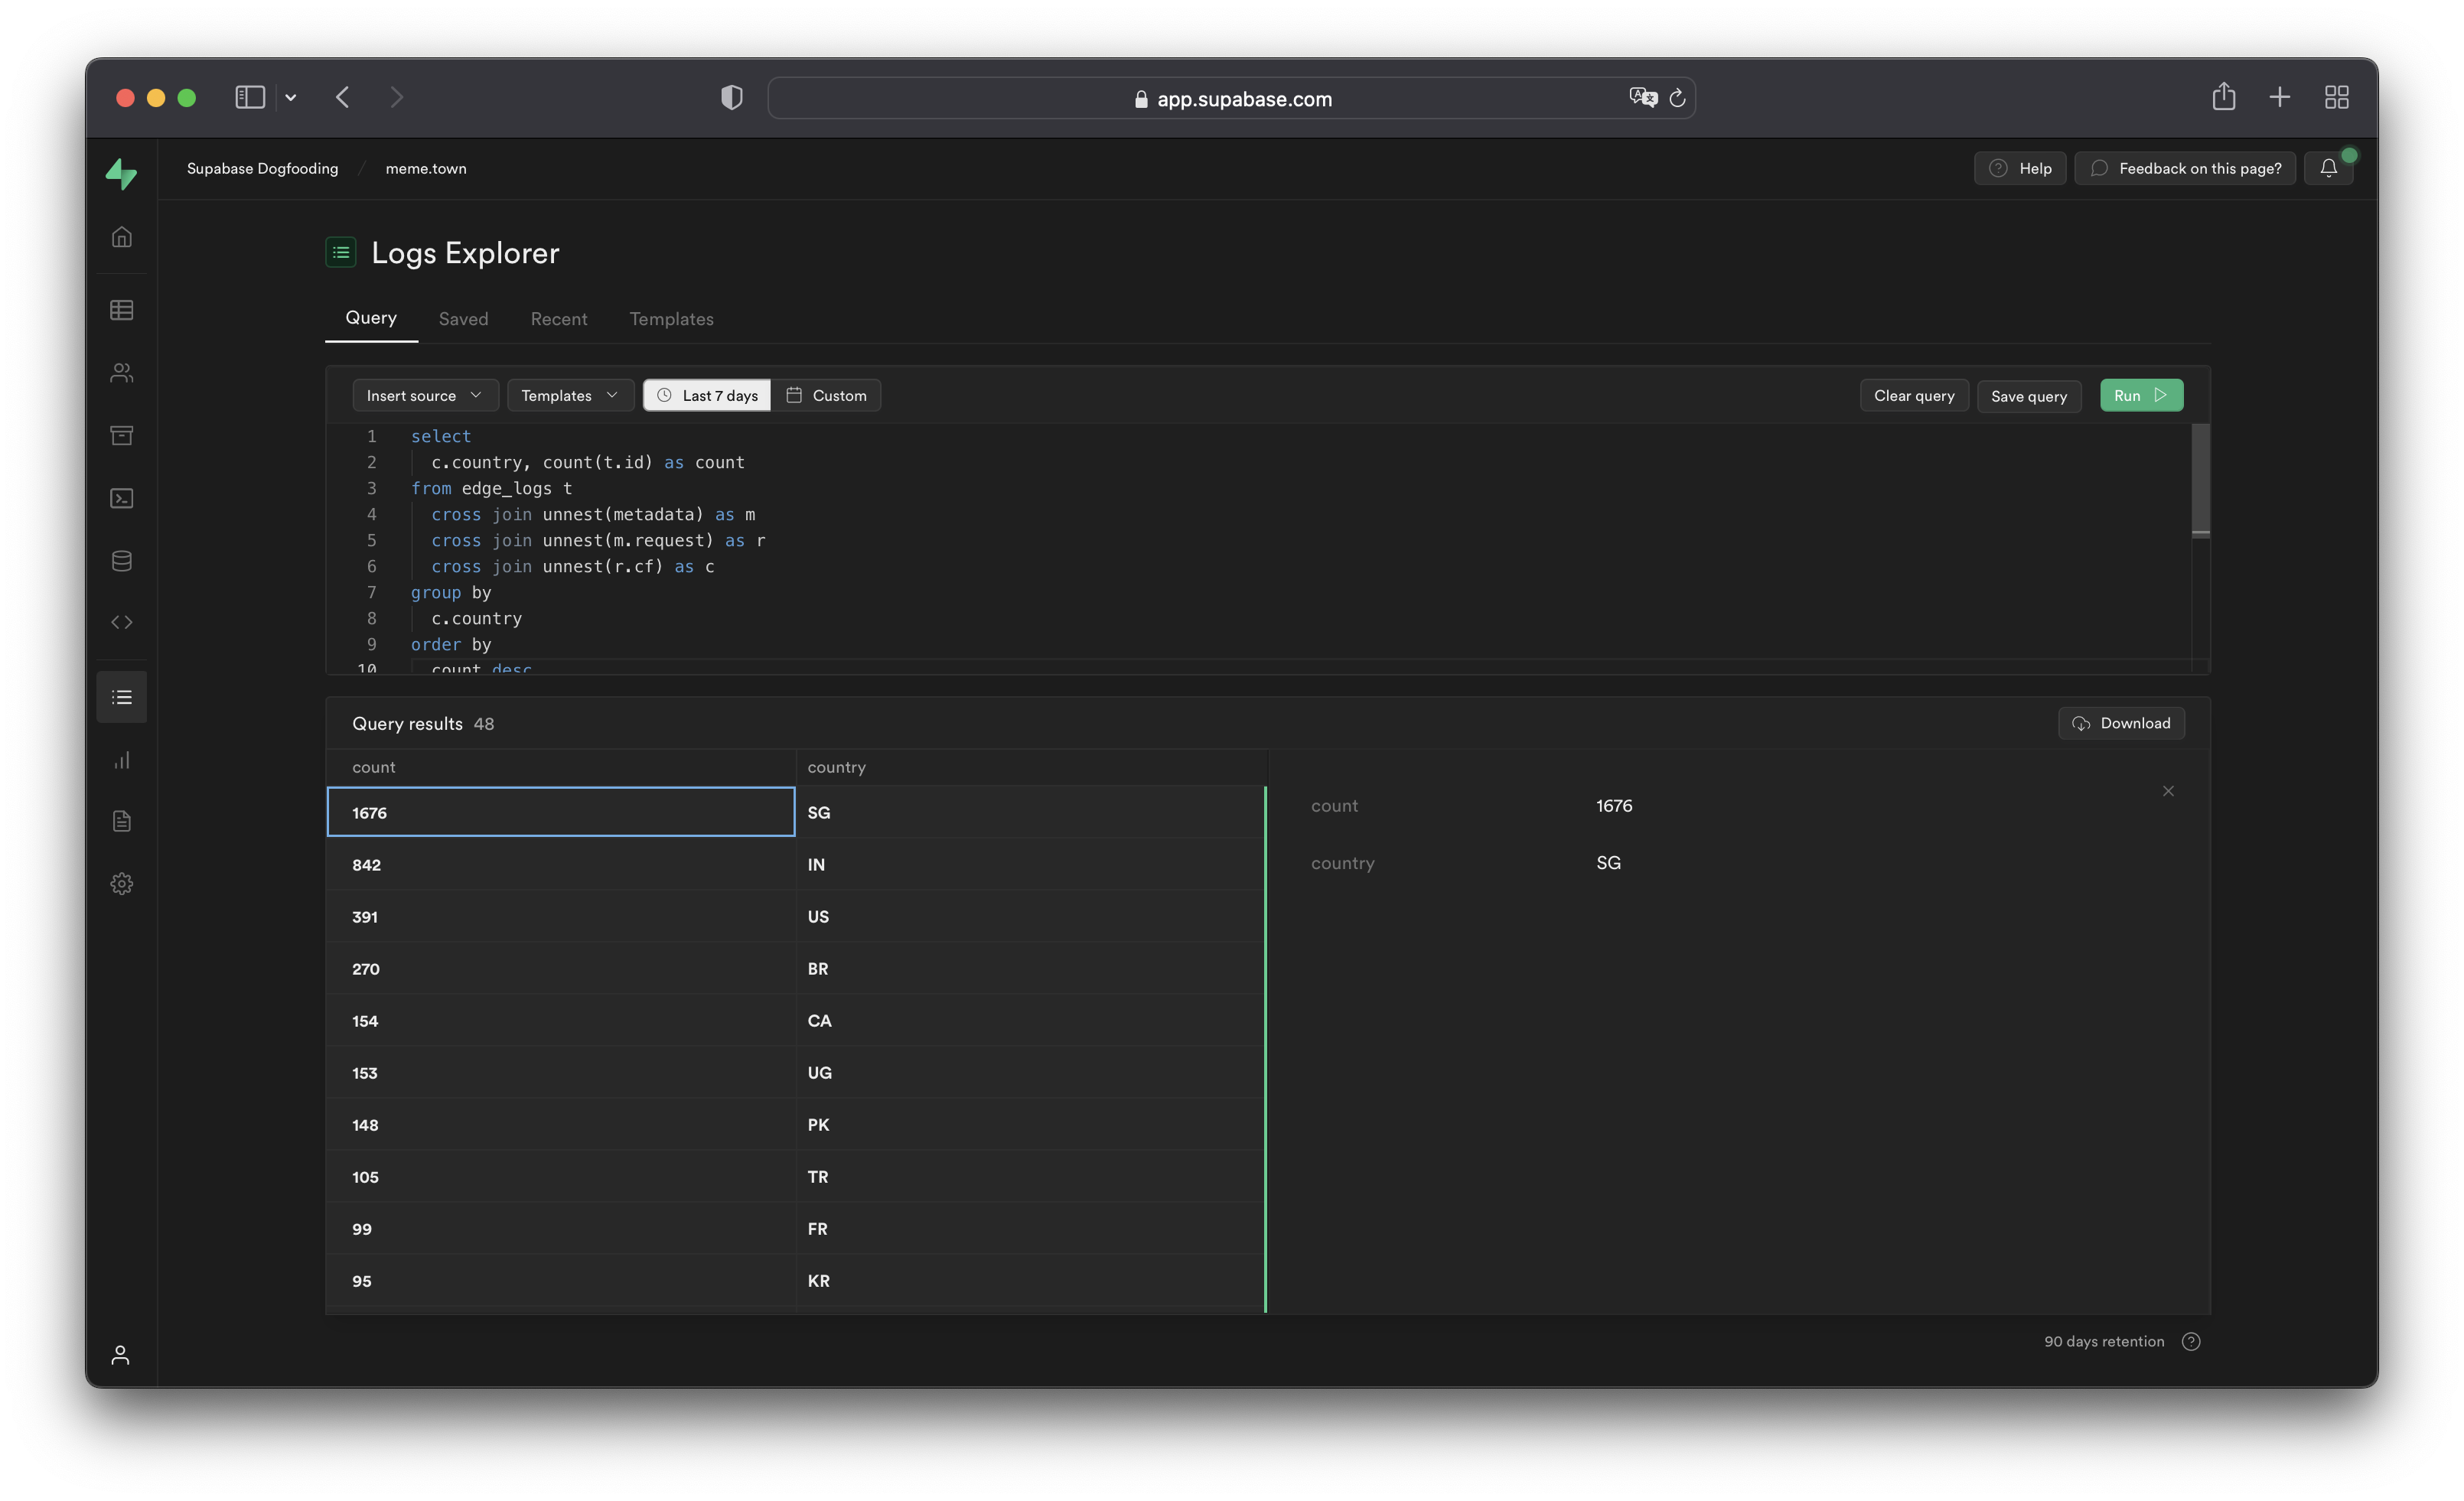
你可以从 Sources 下拉菜单访问以下日志来源:
🌐 You can access the following log sources from the Sources drop-down:
auth_logs:GoTrue 服务器日志,包含身份验证/授权活动。edge_logs:边缘网络日志,包括从 Cloudflare 获取的请求和响应元数据。function_edge_logs:仅适用于边缘功能的边缘网络日志,包含每次执行的网络请求和响应元数据。function_logs:函数内部日志,包含来自边缘函数内部的任何console日志。postgres_logs:Postgres 数据库日志,包含已连接应用执行的语句。realtime_logs:实时服务器日志,包含客户端连接信息。storage_logs:存储服务器日志,包含对象上传和获取信息。
Logs Explorer 运行在 ClickHouse 上。每个来源的每一行日志在一个单独的 logs 表中都是一行,并通过 source 列进行标记。结构化字段存放在 log_attributes 映射中,原始日志行在 event_message 中。通过 source 过滤,可以把查询限定到一个服务。
🌐 The Logs Explorer runs on ClickHouse. Every log line from every source is one row in a single logs table, tagged by a source column. Structured fields live in a log_attributes map, and the raw line is in event_message. Filter by source to scope a query to one service.
自2026年6月起,ClickHouse一直是默认的引擎。这个日期之前创建的项目使用BigQuery,其 cross join unnest(metadata) 语法已被弃用。我们建议将这些查询重写为本指南中显示的ClickHouse语法。
🌐 ClickHouse has been the default engine since June 2026. Projects created before this date use BigQuery, whose cross join unnest(metadata) syntax is deprecated. We recommend rewriting those queries in the ClickHouse syntax shown in this guide.
时间戳显示和行为 #
🌐 Timestamp display and behavior
timestamp 列是一个 UTC 的 DateTime64 值,格式为 ISO-8601 字符串,例如 2026-06-22T09:34:06.215000。你可以直接排序和比较它,所以不需要转换函数。在日志浏览器中,所选的时间范围会自动应用,所以你很少需要手动按 timestamp 过滤。
🌐 The timestamp column is a DateTime64 value in UTC, formatted as an ISO-8601 string like 2026-06-22T09:34:06.215000. You can order and compare it directly, so no conversion function is needed. In the Logs Explorer the selected time range is applied for you, so you rarely need to filter on timestamp by hand.
1select timestamp, event_message2from logs3where source = 'edge_logs'4order by timestamp desc5limit 100;从 log_attributes 读取字段 #
🌐 Reading fields from log_attributes
结构化字段存放在 log_attributes 映射里。用括号访问来读取字段,保持完整的点分键。没有展开嵌套的连接。
🌐 Structured fields live in the log_attributes map. Read a field with bracket access, keeping the full dotted key. There are no unnesting joins.
1select2 log_attributes['request.method'] as method,3 log_attributes['request.path'] as path,4 log_attributes['response.status_code'] as status5from logs6where source = 'edge_logs'7limit 100;这个键保留完整的点分路径,但 metadata 根被去掉了。BigQuery 表示为 metadata.request.cf.country 就是 log_attributes['request.cf.country']。保留完整前缀,而不是缩短它。
🌐 The key keeps the full dotted path, with the metadata root dropped. What BigQuery expressed as metadata.request.cf.country is log_attributes['request.cf.country']. Keep the full prefix rather than shortening it.
映射值总是字符串。要比较或聚合数字字段,请用 toInt32OrZero 封装它,对于缺失或非数字值,它会返回 0:
🌐 Map values are always strings. To compare or aggregate a numeric field, wrap it in toInt32OrZero, which returns 0 for a missing or non-numeric value:
1select count() as server_errors2from logs3where source = 'edge_logs'4 and toInt32OrZero(log_attributes['response.status_code']) between 500 and 599;不要猜测键。从最近的行中发现来源设置的键:
🌐 Do not guess keys. Discover the keys a source sets from recent rows:
1select arrayJoin(mapKeys(log_attributes)) as key, count() as n2from logs3where source = 'postgres_logs'4group by key5order by n desc6limit 100;LIMIT 和结果行限制 #
🌐 LIMIT and result row limitations
日志浏览器每次运行最多显示1000行。使用 LIMIT 可以进一步减少返回的行数。
🌐 The Logs Explorer has a maximum of 1000 rows per run. Use LIMIT to reduce the number of rows returned further.
最佳实践 #
🌐 Best practices
- 使用较窄的时间范围。
日志浏览器会应用你选择的时间范围,所以尽量选择紧凑的范围。查询非常大的时间范围有超时风险,特别是对于有长时间数据保留的企业用户,因为需要扫描更多数据。
🌐 The Logs Explorer applies the time range you select, so keep it tight. Querying a very large range risks timeouts, especially for Enterprise customers with long retention, because of the extra data scanned.
- 只选择你需要的字段。
选择整个 log_attributes 地图,或者每一列,会读取比你需要的更多的数据,从而拖慢查询速度。最好选择特定的键。
🌐 Selecting the whole log_attributes map, or every column, reads far more data than you need and slows the query down. Select the specific keys instead.
1-- ❌ Avoid this: selecting the whole attributes map2select timestamp, log_attributes3from logs4where source = 'edge_logs';56-- ✅ Do this: select only the keys you need7select timestamp, log_attributes['request.method'] as method8from logs9where source = 'edge_logs';示例和模板 #
🌐 Examples and templates
日志探索器包括 模板(在“模板”标签或“查询”标签的下拉菜单中可用),帮助你快速入门。
🌐 The Logs Explorer includes Templates (available in the Templates tab or the dropdown in the Query tab) to help you get started.
例如,你可以在 SQL 编辑器中输入以下查询来获取每个用户的 IP 地址:
🌐 For example, you can enter the following query in the SQL Editor to retrieve each user's IP address:
1select timestamp, log_attributes['request.headers.x_real_ip'] as x_real_ip2from logs3where source = 'edge_logs'4 and log_attributes['request.headers.x_real_ip'] != ''5 and log_attributes['request.method'] = 'GET'6order by timestamp desc7limit 100;理解字段引用 #
🌐 Understanding field references
每个日志源都共享同一个 logs 表。每一行都有这些列:
🌐 Every log source shares the same logs table. Each row has these columns:
| 列 | 描述 |
|---|---|
id | 唯一日志标识符 |
timestamp | 事件记录的时间 |
event_message | 日志消息 |
severity_text | 日志级别(如果源头设置了的话) |
source | 日志来源的服务 |
log_attributes | 按来源结构化的字段,用点路径作为键 |
服务特定的详细信息存放在 log_attributes。例如,在 postgres_logs 中,log_attributes['parsed.error_severity'] 字段存储事件的错误级别。可以用括号访问来读取这些字段:
🌐 Service-specific details live in log_attributes. For example, in postgres_logs the log_attributes['parsed.error_severity'] field holds the error level of an event. Read those fields with bracket access:
1select2 event_message,3 log_attributes['parsed.error_severity'] as error_severity,4 log_attributes['parsed.user_name'] as user_name5from logs6where source = 'postgres_logs'7limit 100;正在扩展结果 #
🌐 Expanding results
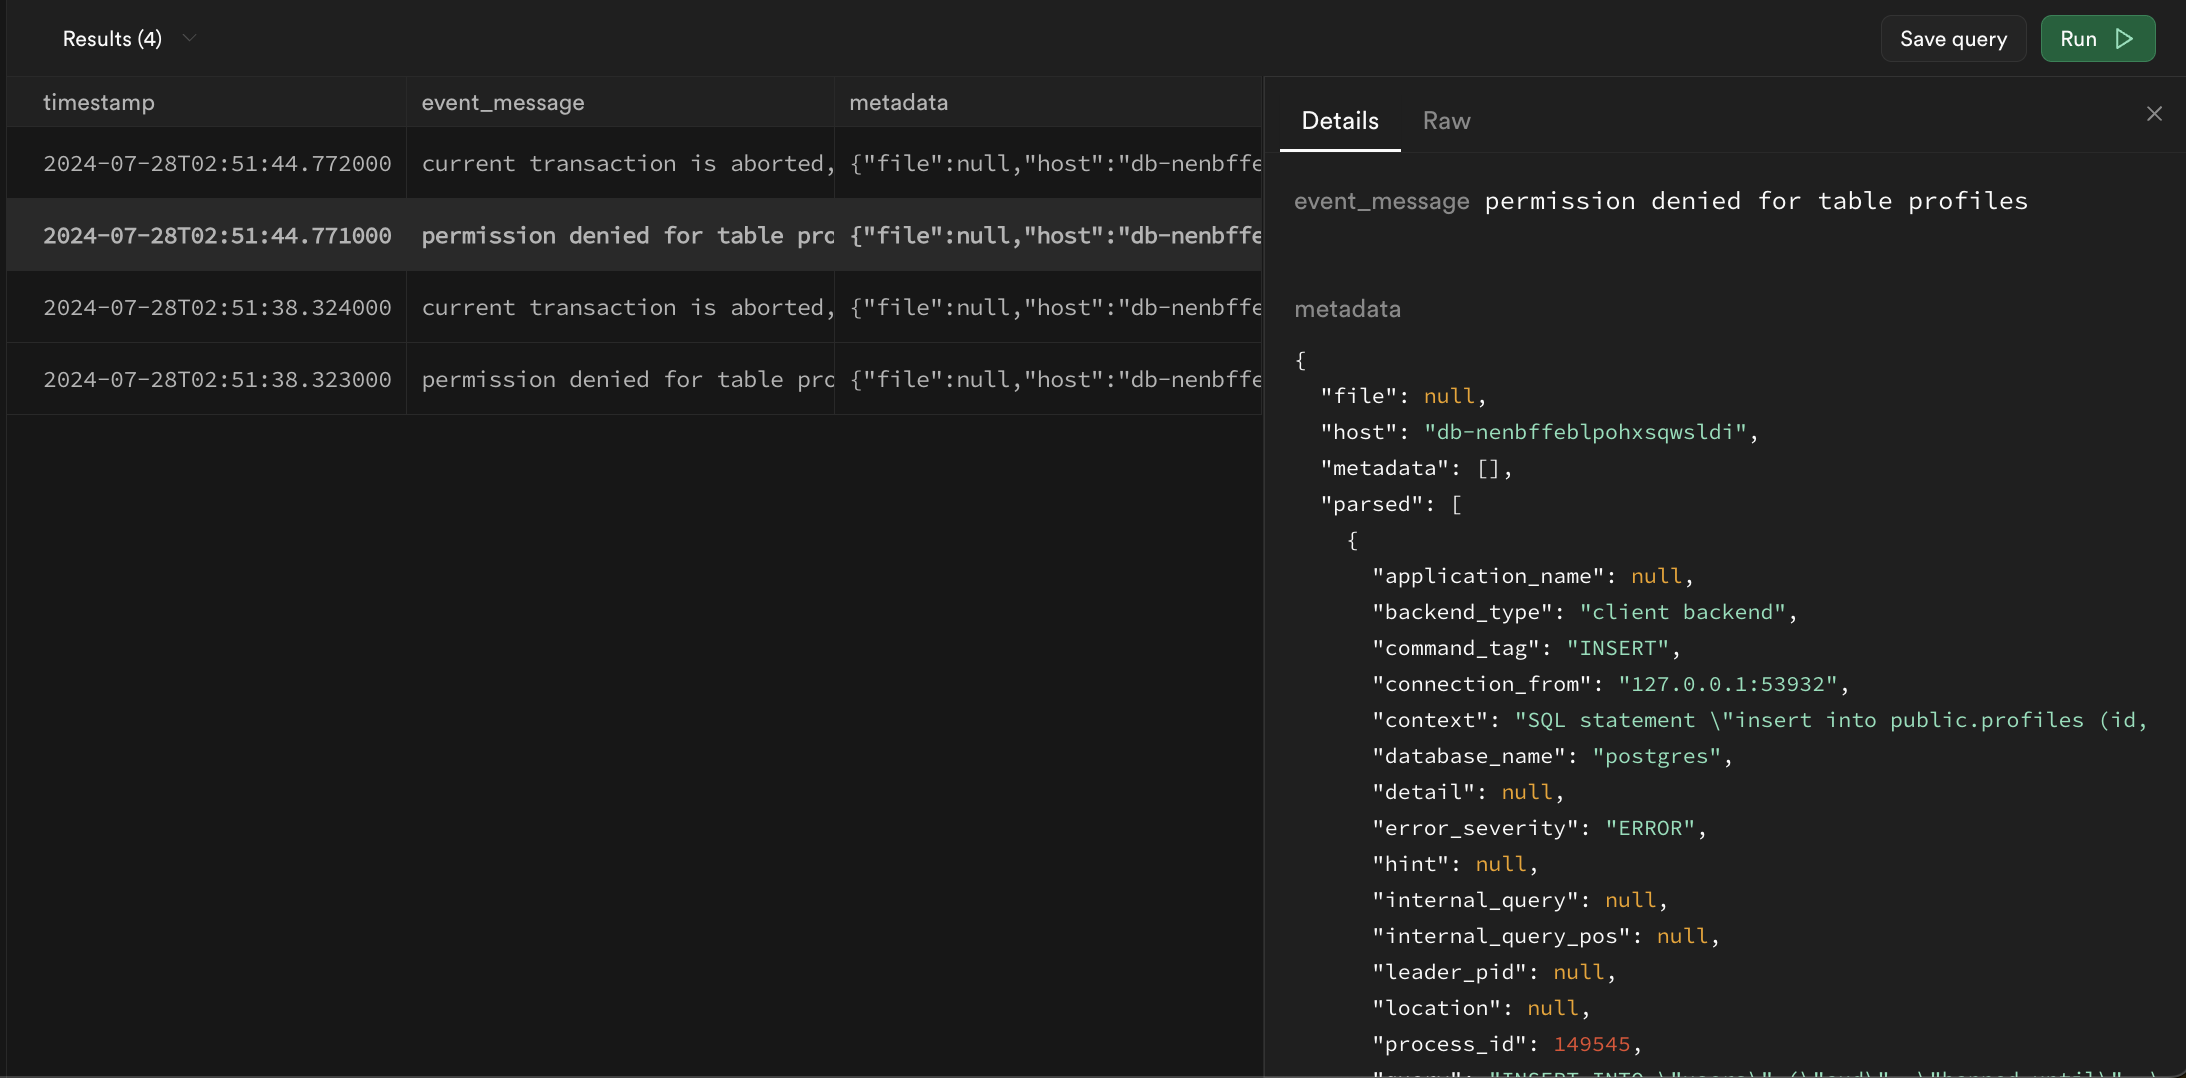
查询返回的日志在表格格式中可能难以阅读。双击一行即可将结果展开为更易读的 JSON:
🌐 Logs returned by queries may be difficult to read in table format. Double-click a row to expand the result into more readable JSON:
使用正则表达式#
🌐 Filtering with regular expressions
使用 ClickHouse 的 match 函数 来处理正则表达式。在最基本的形式下,它会检查某个模式是否出现在列中。
🌐 Use the ClickHouse match function for regular expressions. In its most basic form, it checks whether a pattern is present in a column.
1select timestamp, event_message2from logs3where source = 'postgres_logs'4 and match(event_message, 'is present')5limit 100;有好几个操作符可以考虑使用。
🌐 There are multiple operators to consider using.
查找以某个短语开头的消息 #
🌐 Find messages that start with a phrase
^ 只会在字符串开头查找值
1-- find only messages that start with connection2match(event_message, '^connection')查找以某个短语结尾的消息 #
🌐 Find messages that end with a phrase
$ 只会查找字符串末尾的值
1-- find only messages that end with port=123452match(event_message, 'port=12345$')忽略大小写 #
🌐 Ignore case sensitivity
(?i) 会忽略后续所有字符的大小写
1-- find all event_messages with the word "connection"2match(event_message, '(?i)COnnecTion')对于一个简单的不区分大小写的子字符串匹配,ilike 更简单:
🌐 For a plain case-insensitive substring match, ilike is simpler:
1-- find all event_messages containing "connection", in any case2event_message ilike '%connection%'通配符 #
🌐 Wildcards
. 匹配任意单个字符,.* 匹配任意字符序列
1-- find event_messages like "hello<anything>world"2match(event_message, 'hello.*world')字母数字范围 #
🌐 Alphanumeric ranges
[0-9a-zA-Z] 匹配单个字母或数字字符。用 ^[0-9a-zA-Z]+$ 锚定它,以匹配完全由字母或数字组成的值。
1-- find event_messages that contain a digit between 1 and 5 (inclusive)2match(event_message, '[1-5]')重复的值 #
🌐 Repeated values
x* 零个或多个 x
x+ 一个或多个 x
x? 零个或一个 x
x{4,} 四个或更多 x
x{3} 恰好 3 个 x
1-- find event_messages that contain any sequence of 3 digits2match(event_message, '[0-9]{3}')转义保留字符 #
🌐 Escaping reserved characters
\. 被解释为句点 .,而不是通配符
1-- escapes .2match(event_message, 'hello world\.')or#
🌐 or statements
x|y 任何包含 x 或 y 的字符串
1-- find event_messages that have the word 'started' followed by either "host" or "authenticated"2match(event_message, 'started (host|authenticated)')and/or/not#
🌐 and/or/not statements in SQL
and、or 和 not 是 SQL 中的原生术语,可以和正则表达式一起用来筛选结果
1select timestamp, event_message2from logs3where source = 'postgres_logs'4 and (5 (match(event_message, 'connection') and match(event_message, 'host'))6 or not match(event_message, 'received')7 )8limit 100;过滤示例 #
🌐 Filtering example
筛选 Postgres 错误:
🌐 Filter for Postgres errors:
1select2 timestamp,3 log_attributes['parsed.error_severity'] as error_severity,4 log_attributes['parsed.user_name'] as user_name,5 event_message6from logs7where source = 'postgres_logs'8 and match(log_attributes['parsed.error_severity'], 'ERROR|FATAL|PANIC')9order by timestamp desc10limit 100;限制 #
🌐 Limitations
通配符操作符 *#
🌐 The wildcard operator * is not supported
日志查询界面拒绝 select * 和 count(*)。列出你需要的列,并用 count() 来计算行数:
🌐 The logs query surface rejects select * and count(*). List the columns you need, and use count() for row counts:
1select timestamp, event_message, log_attributes['parsed.error_severity'] as error_severity2from logs3where source = 'postgres_logs'4order by timestamp desc5limit 100;