伐木
Supabase 平台包含一个日志浏览器,可以进行日志跟踪和调试。日志保留时间取决于你的项目定价计划。关于日志使用如何计费的详情,请参见管理日志使用。
🌐 The Supabase Platform includes a Logs Explorer that allows log tracing and debugging. Log retention is based on your project's pricing plan. For details on how Logs usage is billed, see Manage Logs usage.
如果你正在调试某个特定的错误或意外行为,可以先看看调试指南 — 它会根据你的错误代码或症状引导你找到正确的日志来源,然后再打开日志查看器。
🌐 If you are debugging a specific error or unexpected behavior, start with the Debugging guide — it routes you to the right log source based on your error code or symptom before you open the Logs Explorer.
产品日志 #
🌐 Product logs
Supabase 为每个产品提供了专属的日志接口。你可以使用正则表达式来搜索日志事件消息中的关键字和模式。你还可以将符合查询条件的日志事件导出并下载为电子表格。
🌐 Supabase provides a logging interface specific to each product. You can use regular expressions for keywords and patterns to search log event messages. You can also export and download the log events matching your query as a spreadsheet.
有关正则表达式过滤、结构化字段查询和字段发现技巧,请参见高级日志过滤。
🌐 For regular expression filtering, structured-field queries, and field discovery techniques, see Advanced log filtering.
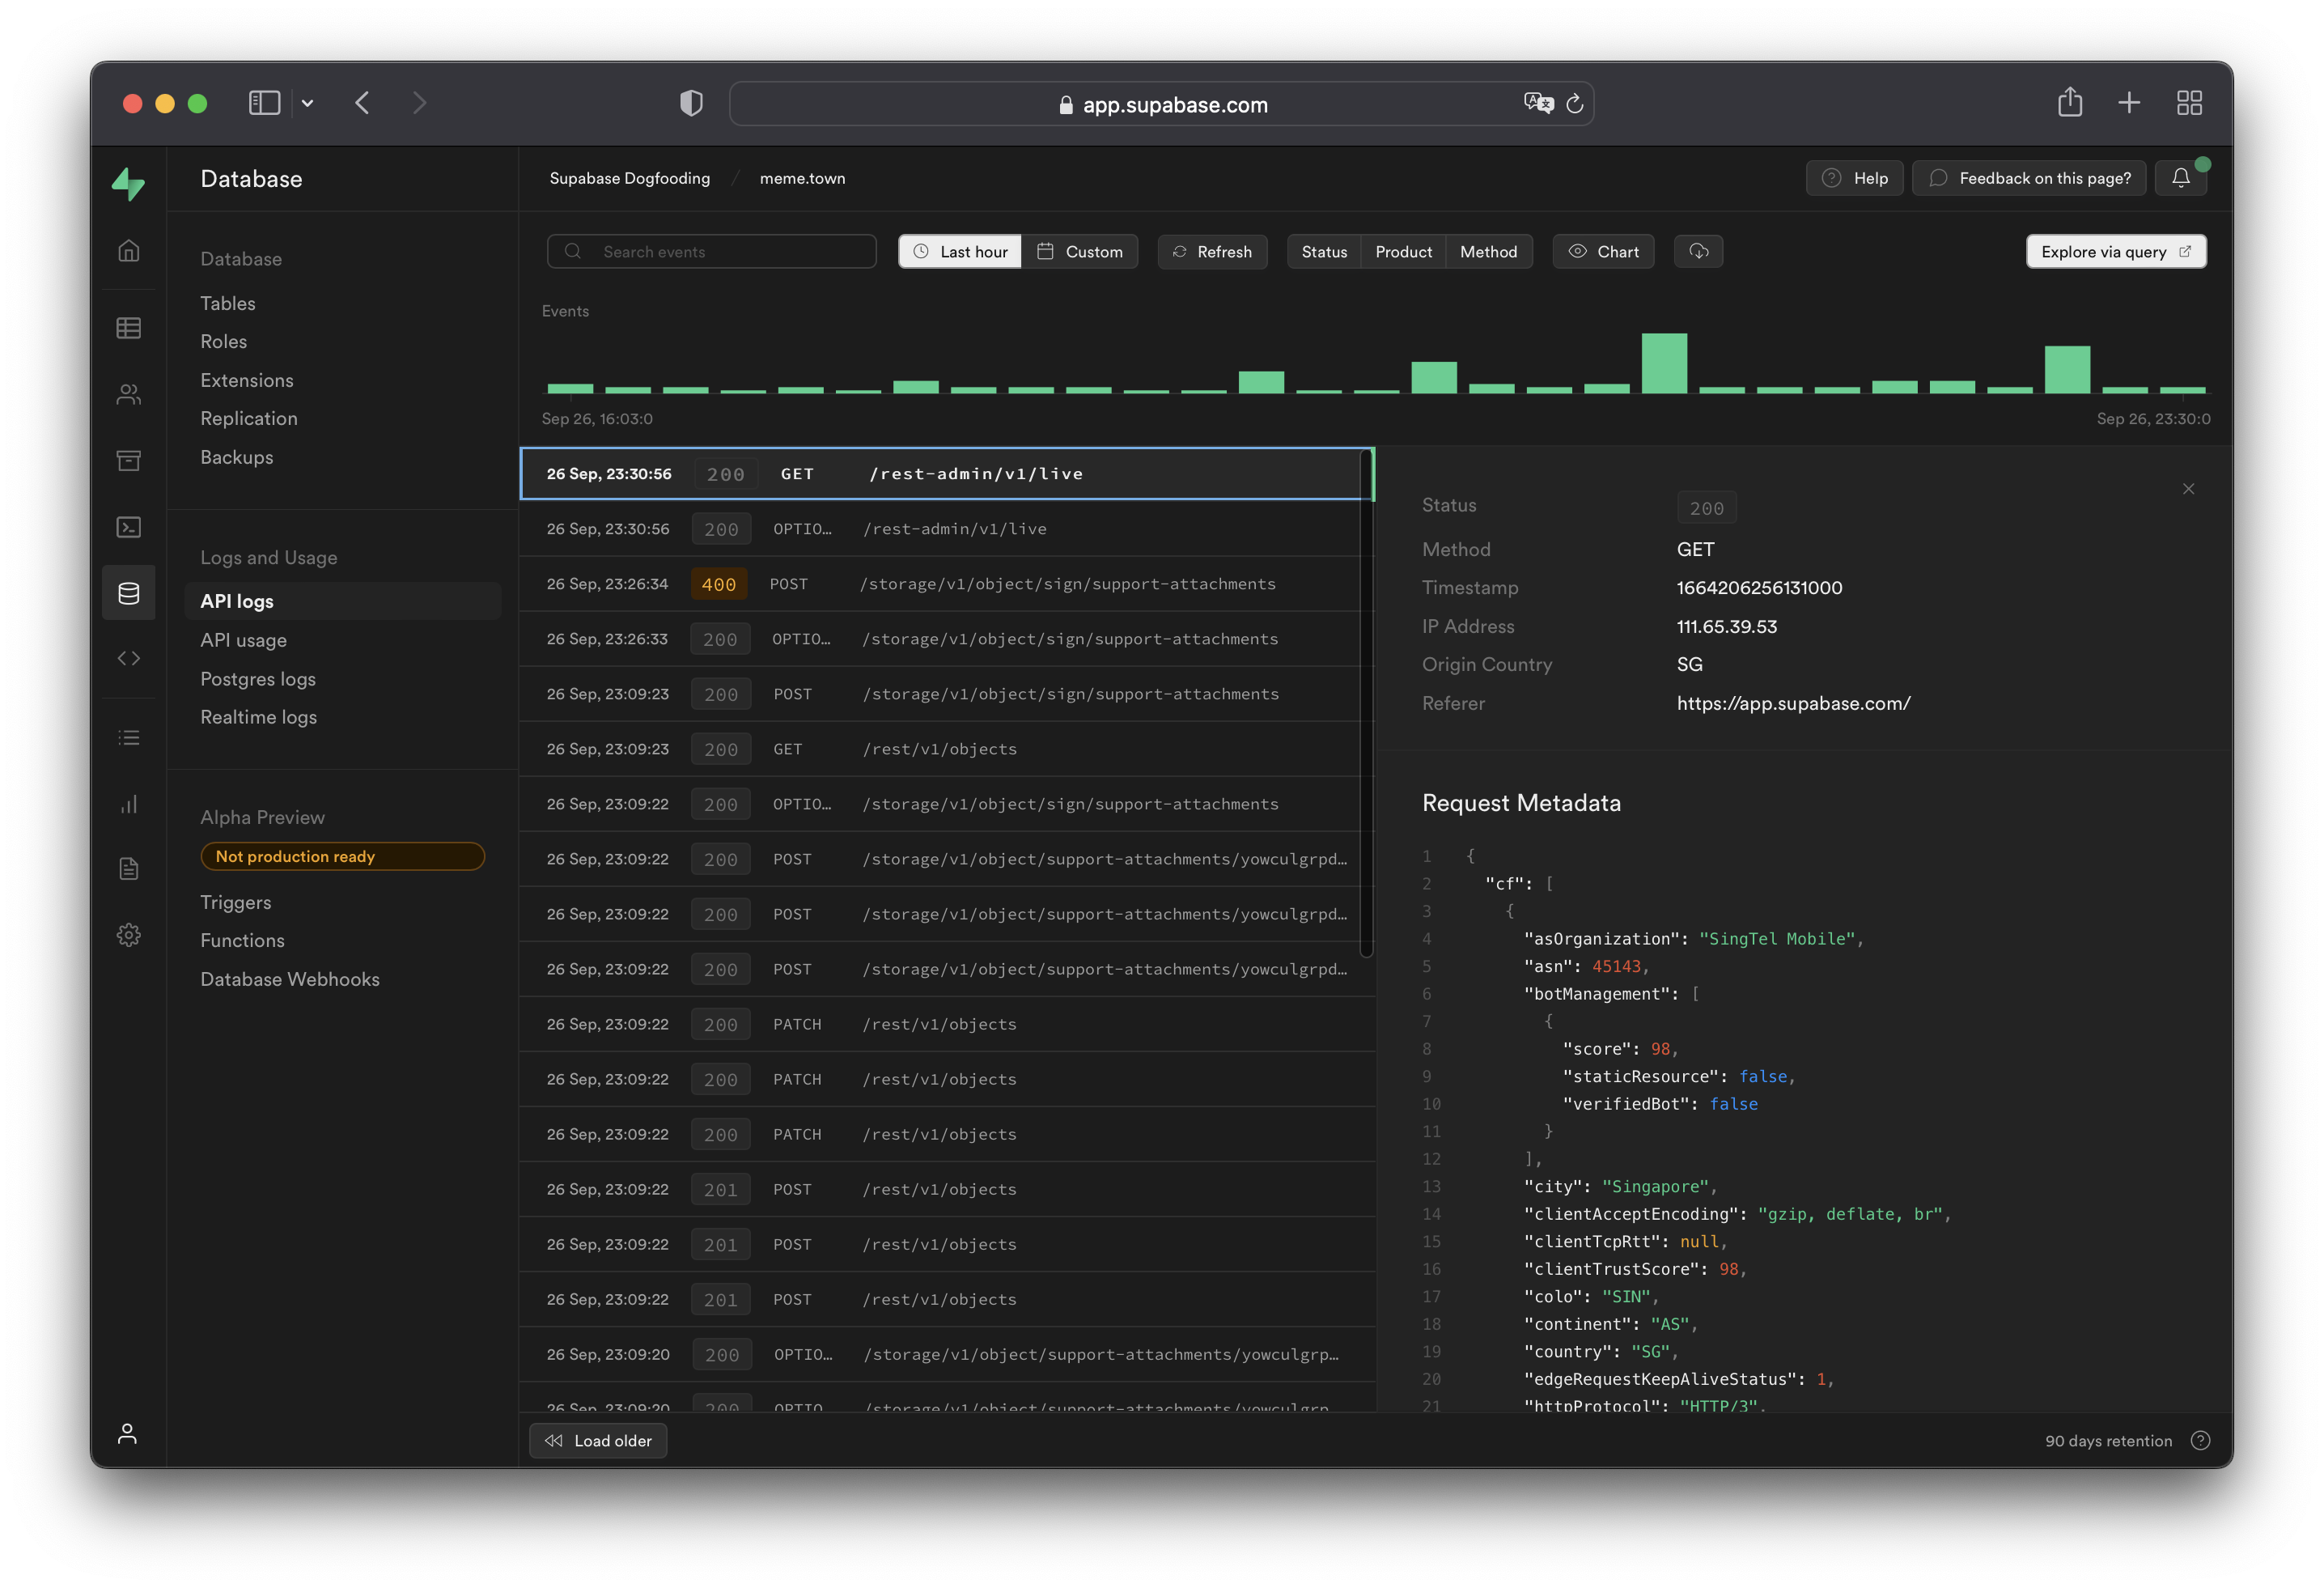
API 日志 显示 REST 和 GraphQL API 的所有网络请求和响应。如果启用了 只读副本,日志会自动在数据库之间以及 API 负载均衡器 端点进行筛选。特定端点的日志可以通过仪表板右上角的 Source 按钮进行切换。
在查看来自 API 负载均衡器端点的日志时,上游数据库或最终处理请求的数据库可以在 Redirect Identifier 字段中找到。这在查询底层日志时,相当于 metadata.load_balancer_redirect_identifier。
🌐 When viewing logs originating from the API Load Balancer endpoint, the upstream database or the one that eventually handles the request can be found under the Redirect Identifier field. This is equivalent to metadata.load_balancer_redirect_identifier when querying the underlying logs.
处理 API 日志 #
🌐 Working with API logs
API 日志 会通过 Cloudflare 边缘服务器,并且在 metadata.request.cf.* 字段下附带 Cloudflare 元数据。
允许的请求头 #
🌐 Allowed headers
在 API 日志中,只允许严格定义的请求和响应头。请求和响应头仍会被服务器和客户端接收,但不会附加到生成的 API 日志中。
🌐 A strict list of request and response headers are permitted in the API logs. Request and response headers will still be received by the server(s) and client(s), but will not be attached to the API logs generated.
请求头:
🌐 Request headers:
acceptcf-connecting-ipcf-ipcountryhostuser-agentx-forwarded-protoreferercontent-lengthx-real-ipx-client-infox-forwarded-user-agentrangeprefer
响应头:
🌐 Response headers:
cf-cache-statuscf-raycontent-locationcontent-rangecontent-typecontent-lengthdatetransfer-encodingx-kong-proxy-latencyx-kong-upstream-latencysb-gateway-modesb-gateway-version
附加请求元数据 #
🌐 Additional request metadata
要给请求附加额外的元数据,建议使用 User-Agent 头,比如用于设备或版本识别。
🌐 To attach additional metadata to a request, it is recommended to use the User-Agent header for purposes such as device or version identification.
例如:
🌐 For example:
1node MyApp/1.2.3 (device-id:abc123)2Mozilla/5.0 (Windows NT 6.1; Win64; x64; rv:47.0) Gecko/20100101 Firefox/47.0 MyApp/1.2.3 (Foo v1.3.2; Bar v2.2.2)不要在 User-Agent 头里记录个人身份信息(PII),以避免违反数据保护隐私法。过于细致和详细的用户代理可能会通过 PII 让终端用户被指纹识别和确认身份。
🌐 Do not log Personal Identifiable Information (PII) within the User-Agent header, to avoid infringing data protection privacy laws. Overly fine-grained and detailed user agents may allow fingerprinting and identification of the end user through PII.
记录 Postgres 连接 #
🌐 Logging Postgres connections
Postgres 可以将连接生命周期事件记录到你项目的 Postgres 日志中,比如客户端连接或认证时。默认情况下,Supabase 对新项目将 log_connections 设置为关闭,你需要先启用它。
🌐 Postgres can log connection lifecycle events to your project's Postgres logs, for example when a client connects or authenticates. By default, Supabase sets log_connections to off for new projects and you must enable it first.
要启用连接日志以进行审计或合规,请参阅 Postgres 连接日志。
🌐 To enable connection logging for audit or compliance, see Postgres connection logging.
在 日志资源管理器 中,连接生命周期消息默认可能是隐藏的。使用侧边栏的连接日志过滤器来显示它们。
🌐 In the Logs Explorer, connection lifecycle messages may be hidden by default. Use the connection logs filter in the sidebar to show them.
记录 Postgres 查询 #
🌐 Logging Postgres queries
要为其他类别的语句启用查询日志:
🌐 To enable query logs for other categories of statements:
- 启用 pgAudit 扩展。
- 配置
pgaudit.log(见下文)。如有需要,快速重启。 - 在 Logs > Postgres 日志 下查看你的查询日志。
配置 pgaudit.log#
🌐 Configuring pgaudit.log
pgaudit.log 下存储的值决定了哪些类型的语句会被 pgAudit 扩展 记录。有关完整的值列表,请参考 pgAudit 文档 完整列表。
🌐 The stored value under pgaudit.log determines the classes of statements that are logged by pgAudit extension. Refer to the pgAudit documentation for the full list of values.
要在单个会话中启用对函数调用/Do 块、写操作和 DDL 语句的日志记录,请在会话中执行以下操作:
🌐 To enable logging for function calls/do blocks, writes, and DDL statements for a single session, execute the following within the session:
1-- temporary single-session config update2set pgaudit.log = 'function, write, ddl';要_永久_设置日志配置(不仅仅是单次会话),执行以下操作,然后快速重启:
🌐 To permanently set a logging configuration (beyond a single session), execute the following, then perform a fast reboot:
1-- equivalent permanent config update.2alter role postgres set pgaudit.log to 'function, write, ddl';为了帮助调试,我们建议将日志范围调整为仅包含相关语句,因为范围过大会导致你的 Postgres 日志中出现大量无用信息。
🌐 To help with debugging, we recommend adjusting the log scope to only relevant statements as having too wide of a scope would result in a lot of noise in your Postgres logs.
请注意,在上面的例子中,角色被设置为 postgres。要记录通过 PostgREST 提供的 HTTP API 的用户流量,请为 authenticator 设置你的配置值。
🌐 Note that in the above example, the role is set to postgres. To log user-traffic flowing through the HTTP APIs powered by PostgREST, set your configuration values for the authenticator.
1-- for API-related logs2alter role authenticator set pgaudit.log to 'write';默认情况下,日志级别会设置为 log。要查看其他级别,请运行以下命令:
🌐 By default, the log level will be set to log. To view other levels, run the following:
1-- adjust log level2alter role postgres set pgaudit.log_level to 'info';3alter role postgres set pgaudit.log_level to 'debug5';请注意,根据 pgAudit log_level 文档,error、fatal 和 panic 是不允许的。
🌐 Note that as per the pgAudit log_level documentation, error, fatal, and panic are not allowed.
要重置系统范围的设置,请执行以下操作,然后快速重启:
🌐 To reset system-wide settings, execute the following, then perform a fast reboot:
1-- resets stored config.2alter role postgres reset pgaudit.log如果在执行 alter role postgres ... 时遇到任何权限错误,很可能是你的项目还没有更新到最新版本的 supautils 补丁,该补丁目前正在逐步推送中。
🌐 If any permission errors are encountered when executing alter role postgres ..., it is likely that your project has yet to receive the patch to the latest version of supautils, which is currently being rolled out.
RAISE#
🌐 RAISEd log messages in Postgres
通过 RAISE INFO、RAISE NOTICE、RAISE WARNING 和 RAISE LOG 手动记录的消息会显示在 Postgres 日志中。请注意,只有达到或高于你设置的日志级别的消息才会显示。消息同步到 Postgres 日志可能需要几分钟时间。
🌐 Messages that are manually logged via RAISE INFO, RAISE NOTICE, RAISE WARNING, and RAISE LOG are shown in Postgres Logs. Note that only messages at or above your logging level are shown. Syncing of messages to Postgres Logs may take a few minutes.
如果你的日志没有显示,可以通过运行以下命令检查你的日志级别:
🌐 If your logs aren't showing, check your logging level by running:
1show log_min_messages;注意,LOG 的等级比 WARNING 和 ERROR 高,所以如果你的等级设置为 LOG,你不会看到 WARNING 和 ERROR 的消息。
🌐 Note that LOG is a higher level than WARNING and ERROR, so if your level is set to LOG, you will not see WARNING and ERROR messages.
限制和警告 #
🌐 Limits and caveats
- Supabase 平台上的 Postgres 日志事件限制为 100,000 个字符。如果日志事件超过此限制,它将被截断。自托管不受此限制。
- 在 Supabase 平台上,内部服务与 Postgres 的内部连接日志不会被记录。这不适用于自托管。
记录实时连接 #
🌐 Logging realtime connections
实时默认不会记录新的 WebSocket 连接或通道加入。通过在实例化 Supabase 客户端时包含 info log_level 参数,可以为每个客户端启用连接日志记录。
🌐 Realtime doesn't log new WebSocket connections or Channel joins by default. Enable connection logging per client by including an info log_level parameter when instantiating the Supabase client.
1import { createClient } from '@supabase/supabase-js'23const options = {4 realtime: {5 params: {6 log_level: 'info',7 },8 },9}10const supabase = createClient('https://xyzcompany.supabase.co', 'sb_publishable_...', options)日志浏览器 #
🌐 Logs Explorer
日志浏览器 将 Supabase 堆栈的每个部分的日志作为单独的表展示,可以用 SQL 查询和关联这些表。
🌐 The Logs Explorer exposes logs from each part of the Supabase stack as a separate table that can be queried and joined using SQL.
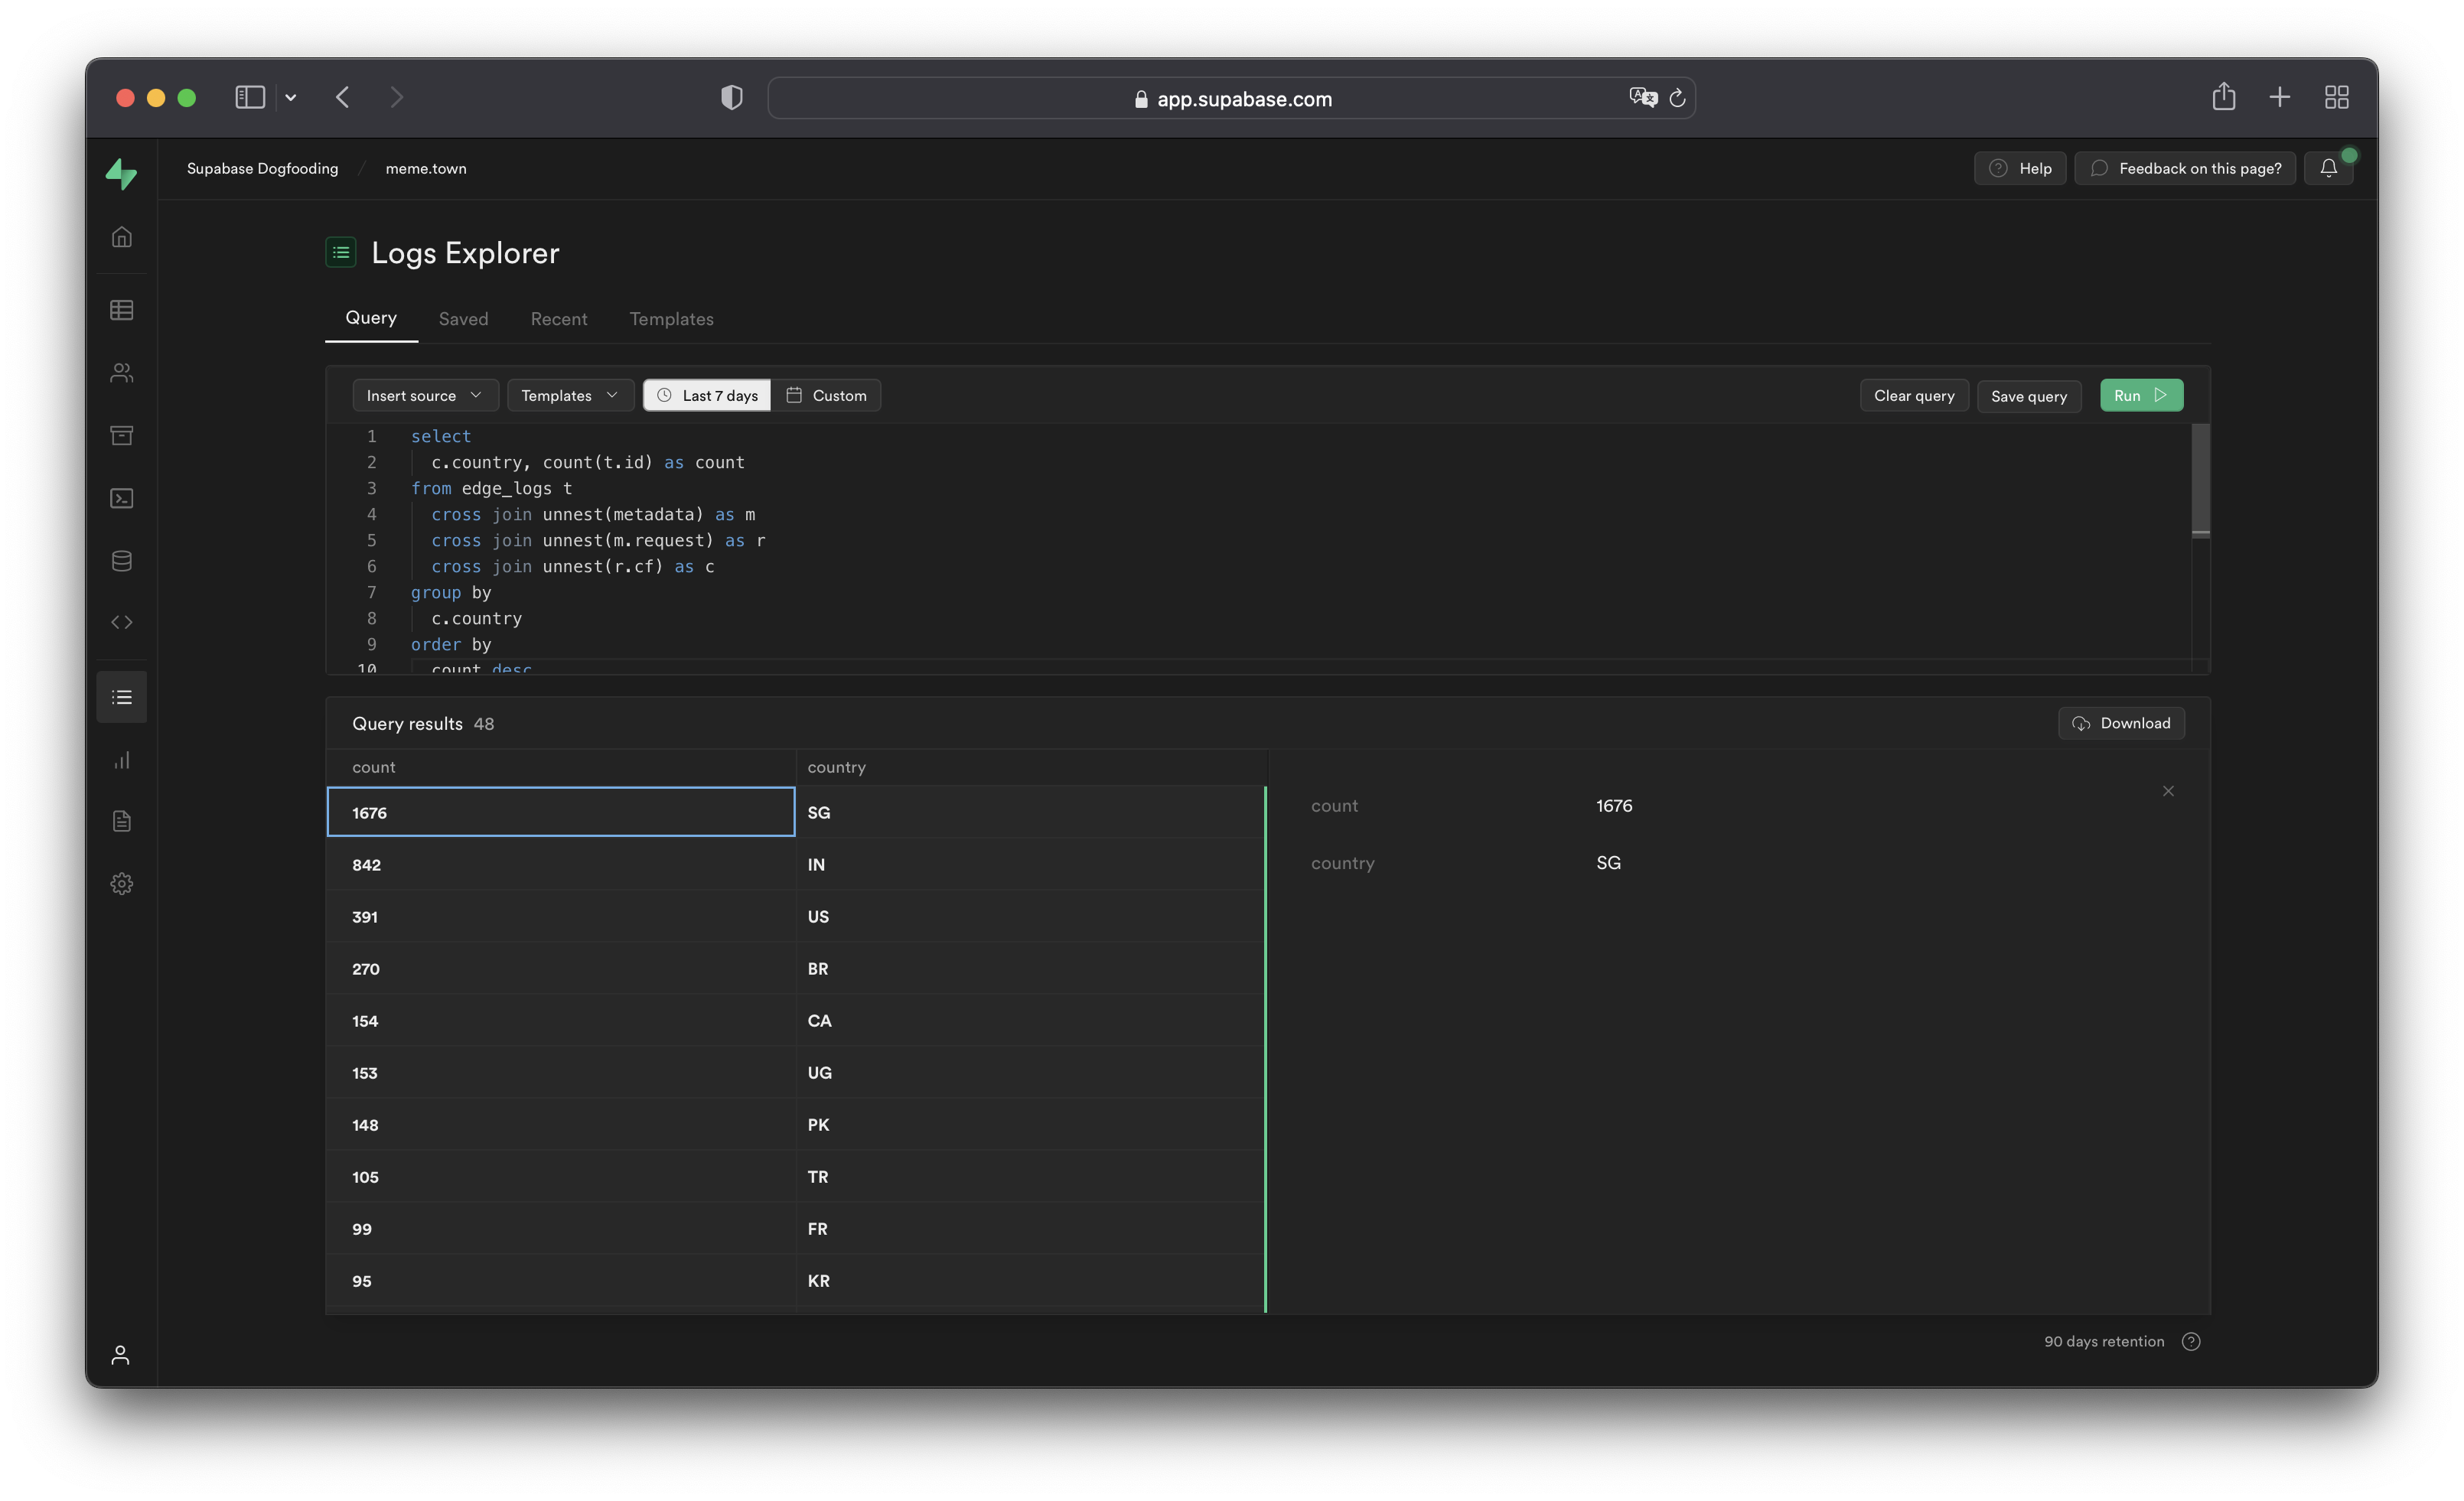
你可以从 Sources 下拉菜单访问以下日志:
🌐 You can access the following logs from the Sources drop-down:
auth_logs:GoTrue 服务器日志,包含身份验证/授权活动。edge_logs:边缘网络日志,包括从 Cloudflare 获取的请求和响应元数据。function_edge_logs:仅适用于边缘功能的边缘网络日志,包含每次执行的网络请求和响应元数据。function_logs:函数内部日志,包含来自边缘函数内部的任何console日志。postgres_logs:Postgres 数据库日志,包含已连接应用执行的语句。realtime_logs:实时服务器日志,包含客户端连接信息。storage_logs:存储服务器日志,包含对象上传和获取信息。
使用日志浏览器查询 #
🌐 Querying with the Logs Explorer
日志浏览器运行在 ClickHouse 上。每个来源的每一条日志行都是 logs 表中的一行,通过 source 列进行标记。结构化字段保存在 log_attributes 映射中,其值为字符串,原始日志行在 event_message 中。
🌐 The Logs Explorer runs on ClickHouse. Every log line from every source is a single row in the logs table, tagged by a source column. Structured fields live in a log_attributes map whose values are strings, and the raw line is in event_message.
自2026年6月起,ClickHouse一直是默认的引擎。这个日期之前创建的项目使用BigQuery,其 cross join unnest(metadata) 语法已被弃用。我们建议将这些查询重写为本指南中显示的ClickHouse语法。
🌐 ClickHouse has been the default engine since June 2026. Projects created before this date use BigQuery, whose cross join unnest(metadata) syntax is deprecated. We recommend rewriting those queries in the ClickHouse syntax shown in this guide.
使用括号访问读取字段,同时保留完整的点分键,例如 log_attributes['request.path'] 而不是 path。用 toInt32OrZero(...) 封装数值,对于缺失或非数值的情况会返回 0。使用 count() 而不是 count(*)。
🌐 Read fields with bracket access, keeping the full dotted key, for example log_attributes['request.path'] rather than path. Wrap numeric values in toInt32OrZero(...), which returns 0 for a missing or non-numeric value. Use count() rather than count(*).
例如,要查找失败的 API 请求:
🌐 For example, to find failing API requests:
1select timestamp,2 toInt32OrZero(log_attributes['response.status_code']) as status,3 log_attributes['request.path'] as path4from logs5where source = 'edge_logs'6 and toInt32OrZero(log_attributes['response.status_code']) >= 4007order by timestamp desc8limit 100;例如,要查找特定的 Postgres SQLSTATE(42501 权限被拒绝,42P01 关系缺失,23505 重复键):
🌐 For example, to find a specific Postgres SQLSTATE (42501 permission denied, 42P01 relation missing, 23505 duplicate key):
1select timestamp, log_attributes['parsed.user_name'] as role, event_message2from logs3where source = 'postgres_logs'4 and log_attributes['parsed.sql_state_code'] = '42501'5order by timestamp desc6limit 100;不要猜 log_attributes 键。缺失的键会返回空字符串而不是错误,所以错误的键会让一个本来正常的查询看起来像空的而不是失败。想办法找到一个源的真实键,或者读取 event_message,它总是包含整行内容。语句文本和错误详情就在那儿,不在 parsed.query 或 parsed.detail,它们通常是空的:
🌐 Do not guess log_attributes keys. A missing key returns an empty string rather than an error, so a wrong key makes a working query look empty instead of failing. Discover the real keys for a source, or read event_message, which always holds the full line. Statement text and error detail live there, not in parsed.query or parsed.detail, which are usually empty:
1select arrayJoin(mapKeys(log_attributes)) as key, count() as n2from logs3where source = 'postgres_logs'4group by key5order by n desc6limit 100;如果你使用 Supabase MCP 服务器,query_logs 工具会像上面那样在托管项目上运行自定义 ClickHouse 查询。get_logs 工具则不用 SQL 就能返回服务的最近日志;在托管项目上它已被弃用,推荐使用 query_logs,但在本地和自托管项目中仍然可以使用。
🌐 If you use the Supabase MCP server, the query_logs tool runs a custom ClickHouse query like the ones above on hosted projects. The get_logs tool returns a service's recent logs without SQL; it is deprecated on hosted projects in favor of query_logs, and remains the option for local and self-hosted projects.
LIMIT 和结果行限制 #
🌐 LIMIT and result row limitations
日志浏览器每次运行最多显示 1000 行。使用 LIMIT 可以通过进一步减少返回的行数来优化你的查询。
🌐 The Logs Explorer has a maximum of 1000 rows per run. Use LIMIT to optimize your queries by reducing the number of rows returned further.
最佳实践 #
🌐 Best practices
- 在时间戳上加个过滤器。
查询你的整个日志历史可能看起来很诱人。对于拥有较长数据保留周期的企业客户来说,你可能会因为扫描更大数据集所需的额外时间而面临超时的风险。
🌐 Querying your entire log history might seem appealing. For Enterprise customers that have a large retention range, you run the risk of timeouts due additional time required to scan the larger dataset.
- 避免选择大型嵌套对象;改为选择单个值。
在查询大对象时,列式存储引擎会选择与每个嵌套键相关的每一列,这导致选择了大量列。这无意间影响了查询速度,并可能导致超时或内存错误,尤其是对于日志很多的项目。
🌐 When querying large objects, the columnar storage engine selects each column associated with each nested key, resulting in a large number of columns being selected. This inadvertently impacts the query speed and may result in timeouts or memory errors, especially for projects with a lot of logs.
相反,只选择所需的数值。
🌐 Instead, select only the values required.
1-- ❌ Avoid this: selecting the whole attributes map2select timestamp, log_attributes3from logs4where source = 'edge_logs';56-- ✅ Do this: select only the keys you need7select timestamp, log_attributes['request.method'] as method8from logs9where source = 'edge_logs';- 一次查询一个来源。
先通过错误码或状态码确定问题属于哪个服务,然后只查询那个来源。一次扫描所有来源会掩盖你需要的信号,而且扫描的数据远超调查所需。
🌐 Identify which service owns the problem from the error or status code first, then query only that source. Scanning every source at once buries the signal you need and scans far more data than the investigation requires.
- 使用锚点跟踪跨来源的请求。 一旦查询给你一个锚点,比如时间戳、请求ID或SQL状态,就用这个锚点过滤相邻的来源,以便在各层之间关联请求(例如
edge_logs到postgres_logs),而不是从头重新扫描每个来源。 - 仅参考你已确认的字段。
拼错或不存在的字段名要么会报错,要么会悄悄返回空值,这会让原本能用的查询看起来空空如也。可以在field reference里确认字段名,或者先选event_message查看一行示例数据。
🌐 A misspelled or non-existent field name either errors or silently returns nothing, which leaves a working query look empty. Confirm field names in the field reference, or select event_message and inspect a sample row first.
日志字段参考 #
🌐 Logs field reference
请参考下面每个来源的完整字段参考。每个来源的结构化字段都列为 ClickHouse 的 log_attributes 键,同时还有每个来源都有的基础列(id、timestamp、event_message、severity_text、source)。
🌐 Refer to the full field reference for each source below. Each source's structured fields are listed as ClickHouse log_attributes keys, alongside the base columns (id, timestamp, event_message, severity_text, source) that every source has.
| 路径 | 类型 |
|---|---|
| id | string |
| timestamp | datetime |
| event_message | string |
| severity_text | string |
| source | string |
| log_attributes['identifier'] | string |
| log_attributes['load_balancer_redirect_identifier'] | string |
| log_attributes['request.cf.asOrganization'] | string |
| log_attributes['request.cf.asn'] | number |
| log_attributes['request.cf.botManagement.corporateProxy'] | boolean |
| log_attributes['request.cf.botManagement.detectionIds'] | number[] |
| log_attributes['request.cf.botManagement.ja3Hash'] | string |
| log_attributes['request.cf.botManagement.score'] | number |
| log_attributes['request.cf.botManagement.staticResource'] | boolean |
| log_attributes['request.cf.botManagement.verifiedBot'] | boolean |
| log_attributes['request.cf.city'] | string |
| log_attributes['request.cf.clientTcpRtt'] | number |
| log_attributes['request.cf.clientTrustScore'] | number |
| log_attributes['request.cf.colo'] | string |
| log_attributes['request.cf.continent'] | string |
| log_attributes['request.cf.country'] | string |
| log_attributes['request.cf.edgeRequestKeepAliveStatus'] | number |
| log_attributes['request.cf.httpProtocol'] | string |
| log_attributes['request.cf.latitude'] | string |
| log_attributes['request.cf.longitude'] | string |
| log_attributes['request.cf.metroCode'] | string |
| log_attributes['request.cf.postalCode'] | string |
| log_attributes['request.cf.region'] | string |
| log_attributes['request.cf.timezone'] | string |
| log_attributes['request.cf.tlsCipher'] | string |
| log_attributes['request.cf.tlsClientAuth.certPresented'] | string |
| log_attributes['request.cf.tlsClientAuth.certRevoked'] | string |
| log_attributes['request.cf.tlsClientAuth.certVerified'] | string |
| log_attributes['request.cf.tlsExportedAuthenticator.clientFinished'] | string |
| log_attributes['request.cf.tlsExportedAuthenticator.clientHandshake'] | string |
| log_attributes['request.cf.tlsExportedAuthenticator.serverFinished'] | string |
| log_attributes['request.cf.tlsExportedAuthenticator.serverHandshake'] | string |
| log_attributes['request.cf.tlsVersion'] | string |
| log_attributes['request.headers.cf_connecting_ip'] | string |
| log_attributes['request.headers.cf_ipcountry'] | string |
| log_attributes['request.headers.cf_ray'] | string |
| log_attributes['request.headers.host'] | string |
| log_attributes['request.headers.referer'] | string |
| log_attributes['request.headers.x_client_info'] | string |
| log_attributes['request.headers.x_forwarded_proto'] | string |
| log_attributes['request.headers.x_real_ip'] | string |
| log_attributes['request.host'] | string |
| log_attributes['request.method'] | string |
| log_attributes['request.path'] | string |
| log_attributes['request.protocol'] | string |
| log_attributes['request.search'] | string |
| log_attributes['request.url'] | string |
| log_attributes['response.headers.cf_cache_status'] | string |
| log_attributes['response.headers.cf_ray'] | string |
| log_attributes['response.headers.content_location'] | string |
| log_attributes['response.headers.content_range'] | string |
| log_attributes['response.headers.content_type'] | string |
| log_attributes['response.headers.date'] | string |
| log_attributes['response.headers.sb_gateway_version'] | string |
| log_attributes['response.headers.transfer_encoding'] | string |
| log_attributes['response.headers.x_kong_proxy_latency'] | string |
| log_attributes['response.origin_time'] | number |
| log_attributes['response.status_code'] | number |