本地调试
Debug your Edge Functions locally using Chrome DevTools for easy breakpoint debugging and code inspection.
自从 v1.171.0 起,Supabase CLI 支持通过 v8 检测器协议调试 Edge Functions,这样就可以通过 Chrome 开发者工具 和其他基于 Chromium 的浏览器进行调试。
🌐 Since v1.171.0 the Supabase CLI supports debugging Edge Functions via the v8 inspector protocol, allowing for debugging via Chrome DevTools and other Chromium-based browsers.
用 Chrome 开发者工具检查 #
🌐 Inspect with Chrome Developer Tools
-
在检查模式下运行你的功能。这会在第一行设置一个断点,在任何代码运行之前暂停脚本执行。
1supabase functions serve --inspect-mode brk -
在你的 Chrome 浏览器中打开
chrome://inspect。 -
点击“发现网络目标”复选框右侧的“配置...”按钮。
-
在打开的目标发现设置对话框中,在空白处输入
127.0.0.1:8083,然后点击“完成”按钮退出对话框。 -
点击“为 Node 打开专用 DevTools”以完成调试准备。打开的 DevTools 窗口现在会监听任何发往 edge-runtime 的请求。
-
向你本地运行的函数发送请求,例如通过 curl 或 Postman。DevTools 窗口现在会在第一行暂停脚本执行。
-
在“来源”标签中,导航到
file://>home/deno/functions/<your-function-name>/index.ts。 -
使用开发者工具设置断点并检查你的 Edge 函数的执行情况。
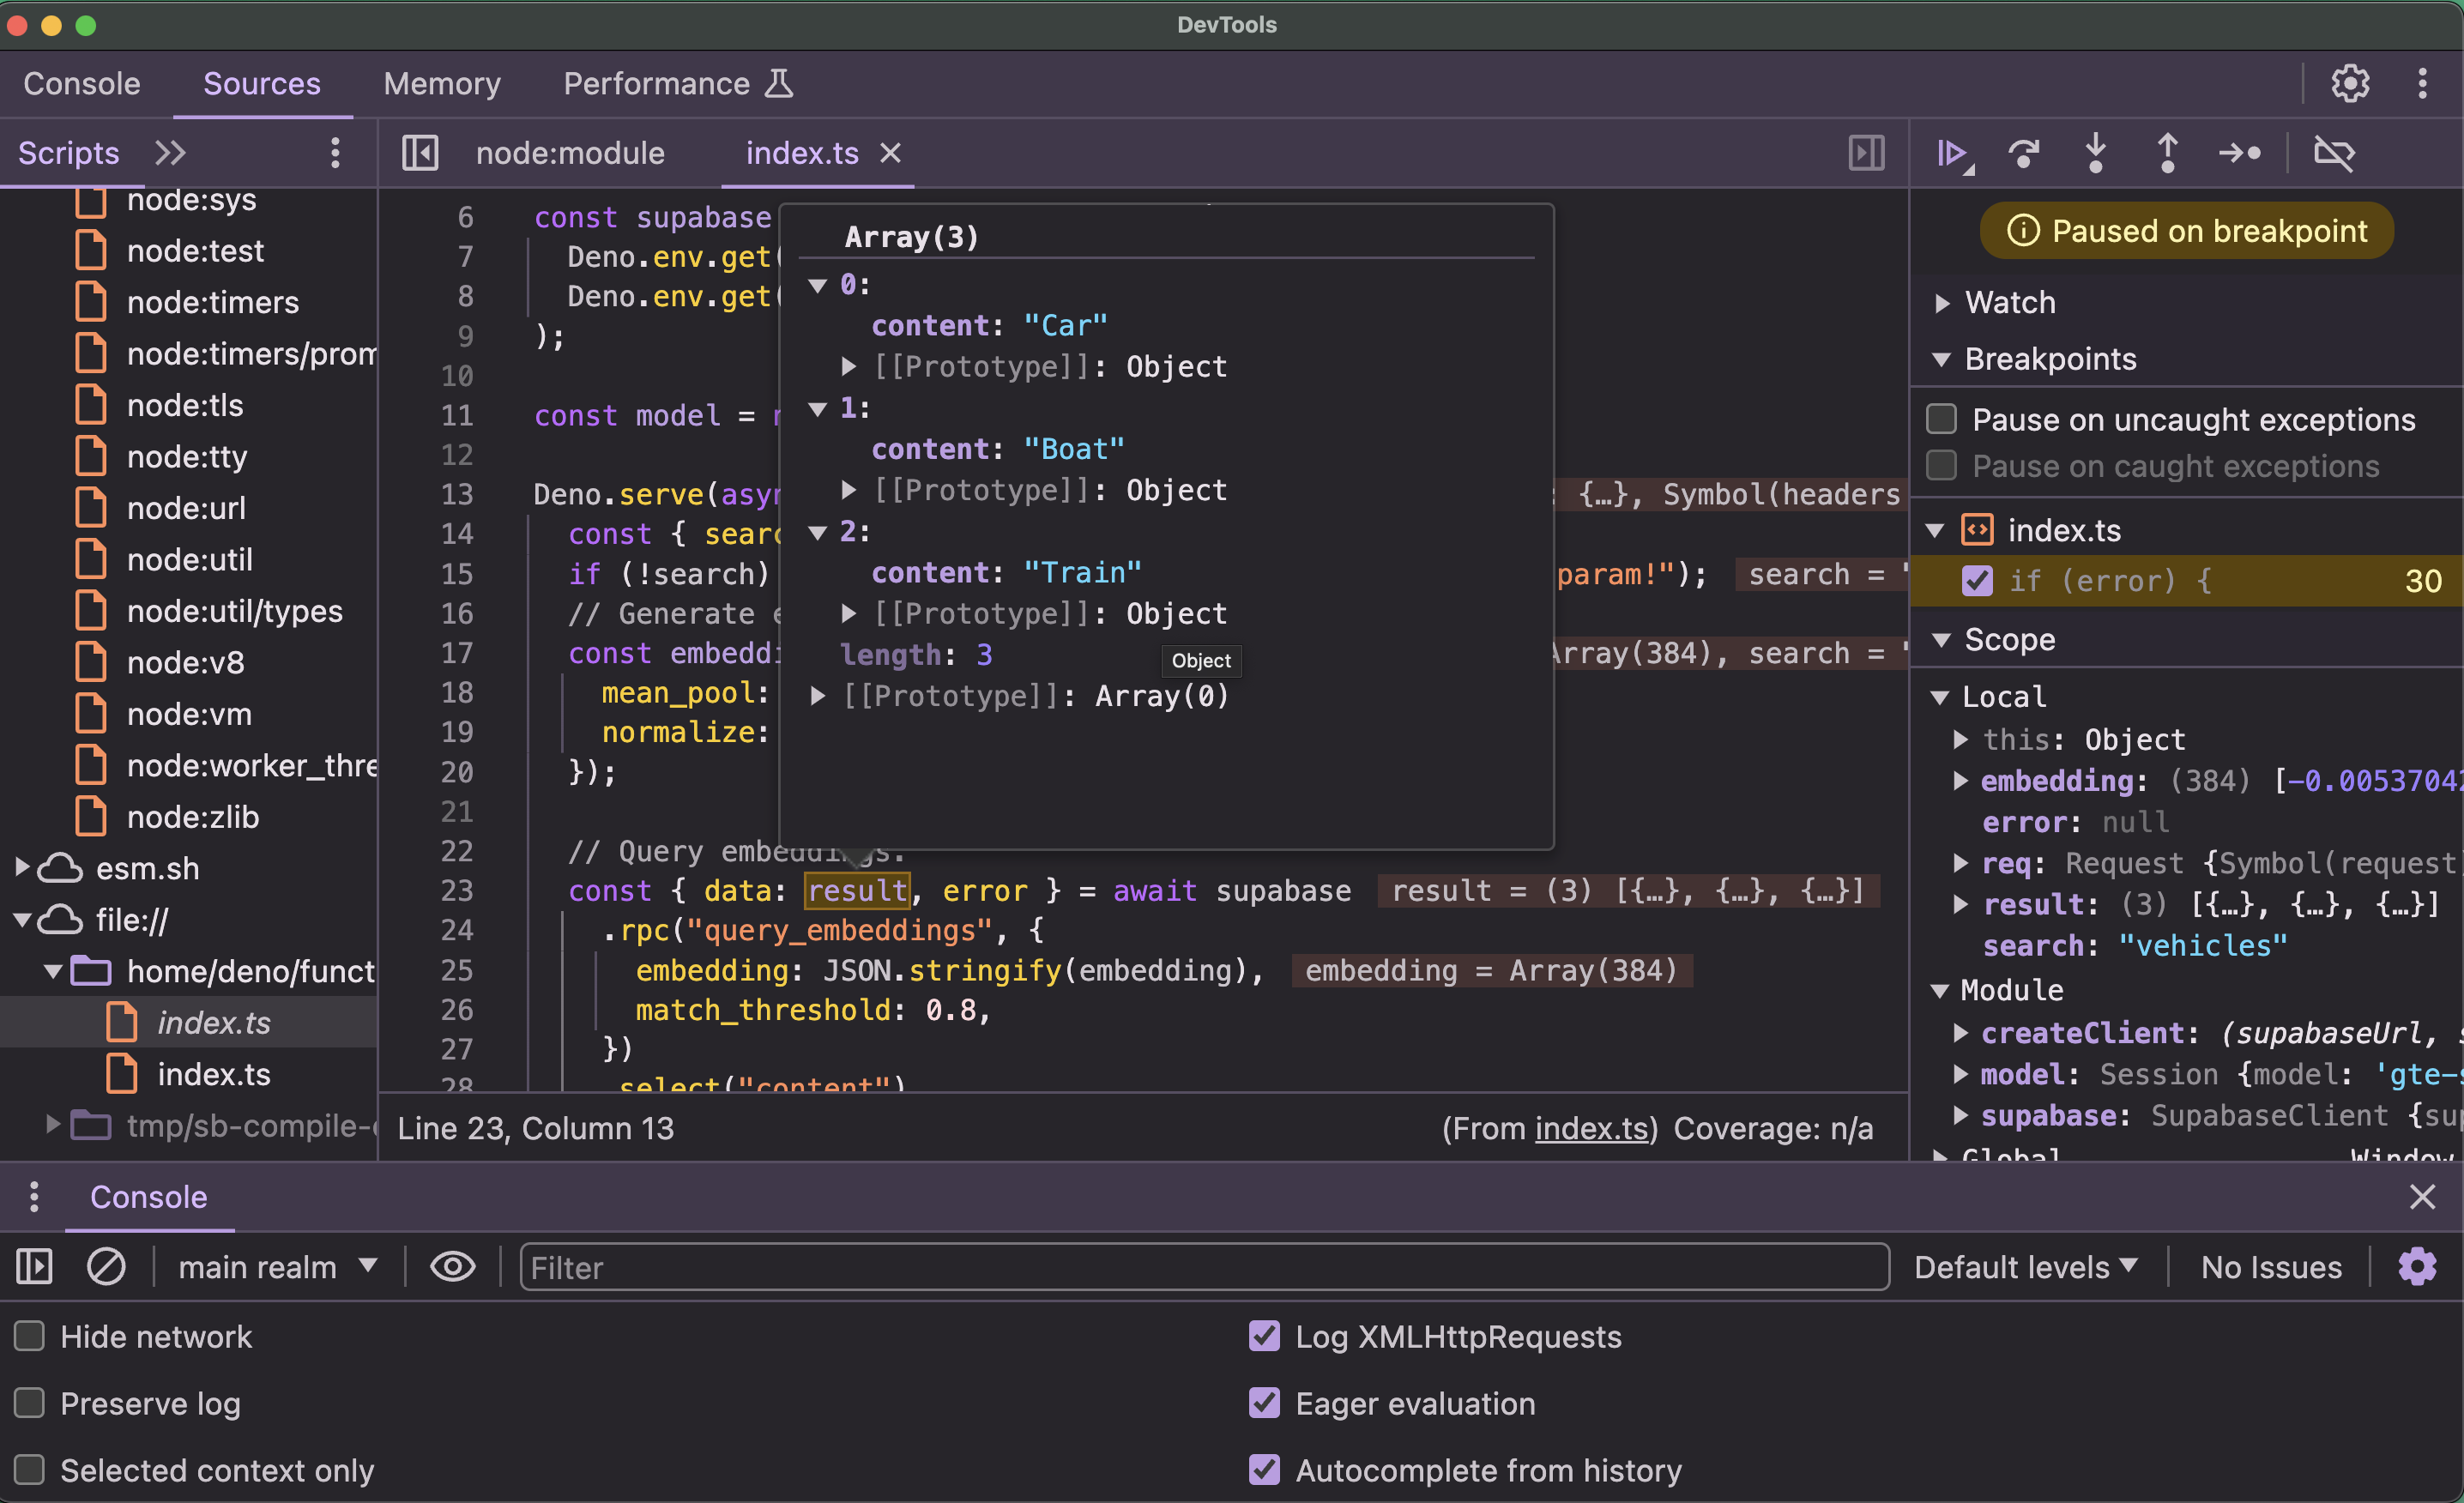
现在你应该已经配置好 Chrome 开发者工具,可以开始调试你的函数了。
🌐 Now you should have Chrome DevTools configured and ready to debug your functions.