连接管理
Using your connections resourcefully
连接 #
🌐 Connections
每个 Compute Add-On 都有预配置的直接连接数量和 Supavisor 池大小。本指南讨论了如何有效地观察和管理它们。
🌐 Every Compute Add-On has a pre-configured direct connection count and Supavisor pool size. This guide discusses ways to observe and manage them resourcefully.
配置 Supavisor 的池大小 #
🌐 Configuring Supavisor's pool size
你可以通过在 数据库设置 的“连接池”部分更改池大小,来调整 Supavisor 可以管理的数据库连接数量:
🌐 You can change how many database connections Supavisor can manage by altering the pool size in the "Connection pooling" section of the Database Settings:
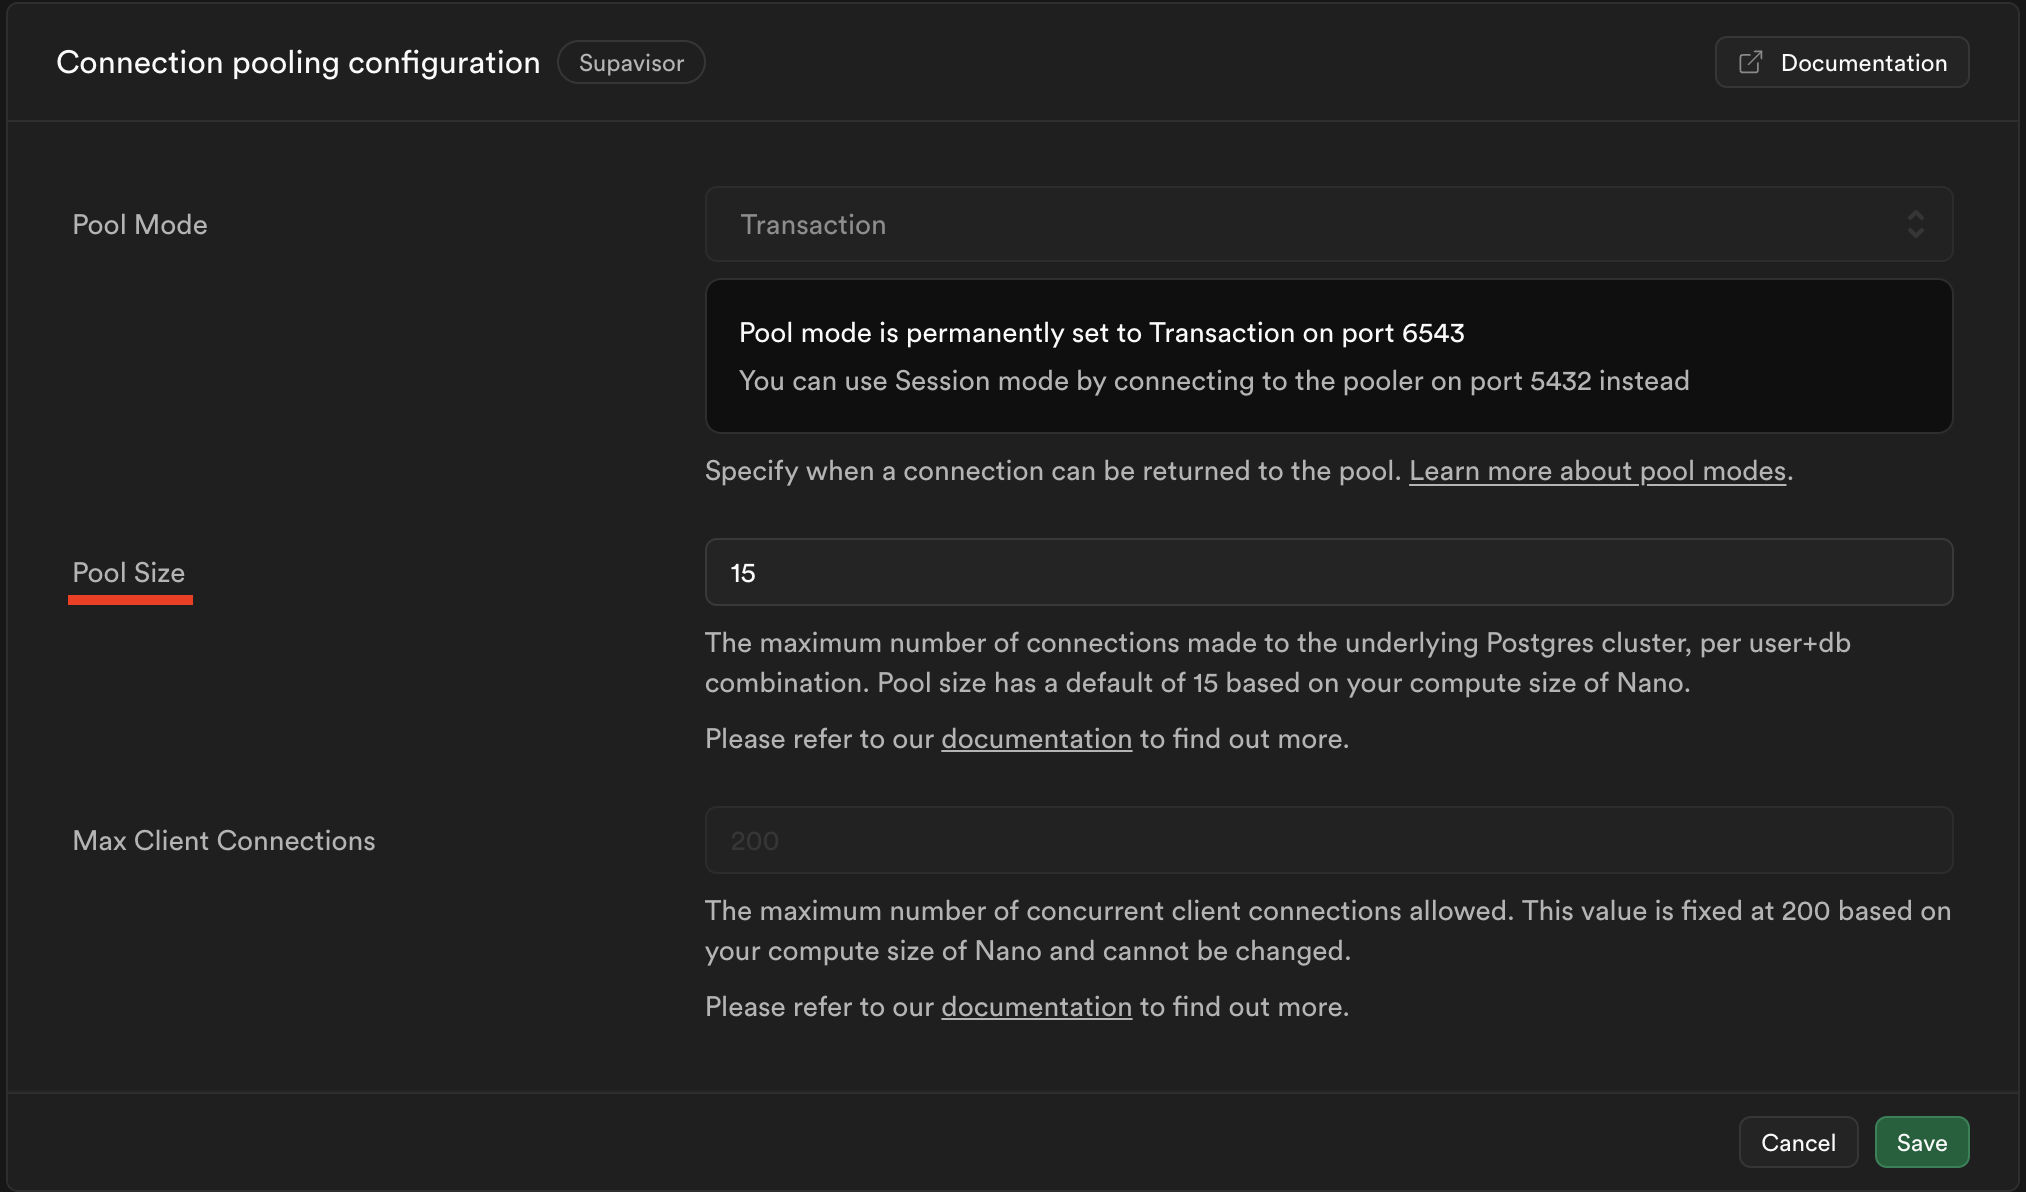
一般的规则是,如果你大量使用 PostgREST 数据库 API,你应该注意不要将连接池大小提高到超过数据库最大连接数的 40%。否则,你可以将 80% 的连接数分配给连接池。这为认证服务器和其他工具留出了足够的空间。
🌐 The general rule is that if you are heavily using the PostgREST database API, you should be conscientious about raising your pool size past 40% of the Database Max Connections. Otherwise, you can commit 80% to the pool. This leaves adequate room for the Authentication server and other utilities.
这些数字只是概括,而且取决于你使用的其他 Supabase 产品以及使用的程度。实际数值取决于你同时在线的高峰连接数。例如,如果你在一周内只使用了 80 个连接,而你的数据库最大连接数设置为 500,那么实际上你可以把剩下的 420(减去合理的缓冲)分配给更多的需求。
🌐 These numbers are generalizations and depends on other Supabase products that you use and the extent of their usage. The actual values depend on your concurrent peak connection usage. For instance, if you were only using 80 connections in a week period and your database max connections is set to 500, then realistically you could allocate the difference of 420 (minus a reasonable buffer) to service more demand.
监控连接 #
🌐 Monitoring connections
记录历史用法 #
🌐 Capturing historical usage
仪表盘监控图表 #
🌐 Dashboard monitoring charts

对于团队和企业计划,Supabase 在仪表板中直接提供高级遥测图表。Database client connections 图表显示按连接类型划分的历史连接数据:
🌐 For Teams and Enterprise plans, Supabase provides Advanced Telemetry charts directly within the Dashboard. The Database client connections chart displays historical connection data broken down by connection type:
- Postgres:直接从你的应用连接
- PostgREST:来自 PostgREST API 层的连接
- 保留:Supabase 服务的管理连接
- 认证:来自 Supabase 认证服务的连接
- 存储:来自 Supabase 存储服务的连接
- 其他角色:各种数据库连接
这个图表帮助你监控连接池的使用情况,发现连接泄漏,并进行容量规划。它还显示了与你的计算规模最大连接数相关的参考线。
🌐 This chart helps you monitor connection pool usage, identify connection leaks, and plan capacity. It also shows a reference line for your compute size's maximum connection limit.
想了解更多关于使用这些监控图表的详情,请查看 报告指南。
🌐 For more details on using these monitoring charts, see the Reports guide.
Grafana 仪表板 #
🌐 Grafana Dashboard
Supabase 提供了一个 Grafana 仪表板,可以记录和可视化超过 200 个项目指标,包括连接情况。有关设置说明,请查看 指标文档。
🌐 Supabase offers a Grafana Dashboard that records and visualizes over 200 project metrics, including connections. For setup instructions, check the metrics docs.
它的“客户端连接”图显示了 Supavisor 和 Postgres 的连接情况
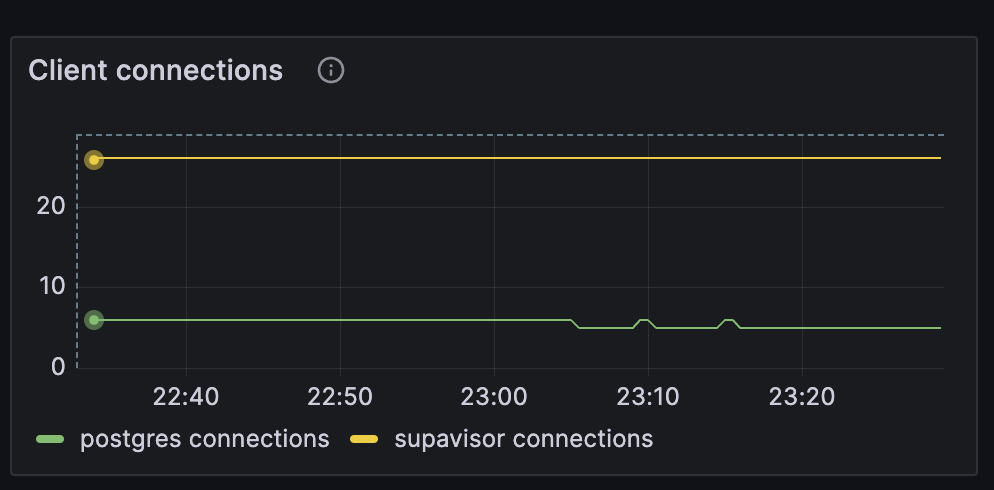
🌐 Its "Client Connections" graph displays connections for both Supavisor and Postgres
观察实时连接 #
🌐 Observing live connections
pg_stat_activity 是一个特殊的视图,它可以跟踪你的数据库正在运行的进程,包括活跃的连接。它特别有用来判断空闲的客户端是否占用了连接槽位。
查询所有活动连接:
🌐 Query to get all live connections:
1SELECT2 pg_stat_activity.pid as connection_id,3 ssl,4 datname as database,5 usename as connected_role,6 application_name,7 client_addr as IP,8 query,9 query_start,10 state,11 backend_start12FROM pg_stat_ssl13JOIN pg_stat_activity14ON pg_stat_ssl.pid = pg_stat_activity.pid;解读这个查询:
🌐 Interpreting the query:
| 列 | 描述 |
|---|---|
connection_id | 连接ID |
ssl | 是否使用了SSL |
database | 已连接数据库的名称(通常是 postgres) |
usename | 已连接用户的角色 |
application_name | 连接应用的名称 |
client_addr | 连接服务器的IP地址 |
query | 连接执行的最后一个查询 |
query_start | 上一次查询执行的时间 |
state | 查询状态:活跃或空闲 |
backend_start | 连接建立的时间戳 |
用户名可以用来识别来源:
🌐 The username can be used to identify the source:
| 角色 | API/工具 |
|---|---|
supabase_admin | Supabase 用于监控和 Realtime |
authenticator | 数据 API (PostgREST) |
supabase_auth_admin | 认证 |
supabase_storage_admin | 存储 |
supabase_replication_admin | 同步只读副本 |
postgres | Supabase 仪表板和外部工具(例如 Prisma、SQLAlchemy、PSQL...) |
| 用户定义的自定义角色 | 外部工具(例如 Prisma、SQLAlchemy、PSQL...) |